체크포인트
Working with Pivots
/ 20
Reordering columns and removing fields
/ 20
Writing table calculations
/ 20
Using table calculations
/ 20
Functions and operators
/ 20
Looker Functions and Operators
GSP857

Overview
Looker is a modern data platform in Google Cloud that lets you analyze and visualize your data interactively. You can use Looker to do in-depth data analysis, integrate insights across different data sources, build actionable data-driven workflows, and create custom data applications. With Looker and Google Cloud, you can deliver actionable business insights at the point of decision, create new value streams, and infuse data into products and workflows to move the business forward.
In this lab, you learn how to use Looker to pivot dimensions, reorder columns, remove fields, and use table calculations. For this lab, an Explore of the Federal Aviation Administration's (FAA) Airport data has been created for you. This dataset contains information on different attributes of airports such as city, date of commission, facility type, etc.
You can learn more about creating Explores in the Looker in Exploring data in Looker documentation.
Objectives
In this lab, you learn how to:
- Pivot dimensions
- Reorder columns and remove fields
- Use table calculations and functions
Setup and requirements
Before you click the Start Lab button
Read these instructions. Labs are timed and you cannot pause them. The timer, which starts when you click Start Lab, shows how long Google Cloud resources will be made available to you.
This hands-on lab lets you do the lab activities yourself in a real cloud environment, not in a simulation or demo environment. It does so by giving you new, temporary credentials that you use to sign in and access Google Cloud for the duration of the lab.
To complete this lab, you need:
- Access to a standard internet browser (Chrome browser recommended).
- Time to complete the lab---remember, once you start, you cannot pause a lab.
How to start your lab and sign in to Looker
-
When ready, click
.
A new panel will appear with the temporary credentials that you must use for this lab.
If you need to pay for the lab, a pop-up will open for you to select your payment method.
-
Note your lab credentials in the left pane. You will use them to sign in to the Looker instance for this lab.
Note: If you use other credentials, you will get errors or incur charges. -
Click Open Looker.
-
Enter the provided Username and Password in the Email and Password fields.
Important: You must use the credentials from the Connection Details panel on this page. Do not use your Google Cloud Skills Boost credentials. If you have your own Looker account, do not use it for this lab. -
Click Log In.
After a successful login, you will see the Looker instance for this lab.
Task 1. Pivot dimensions
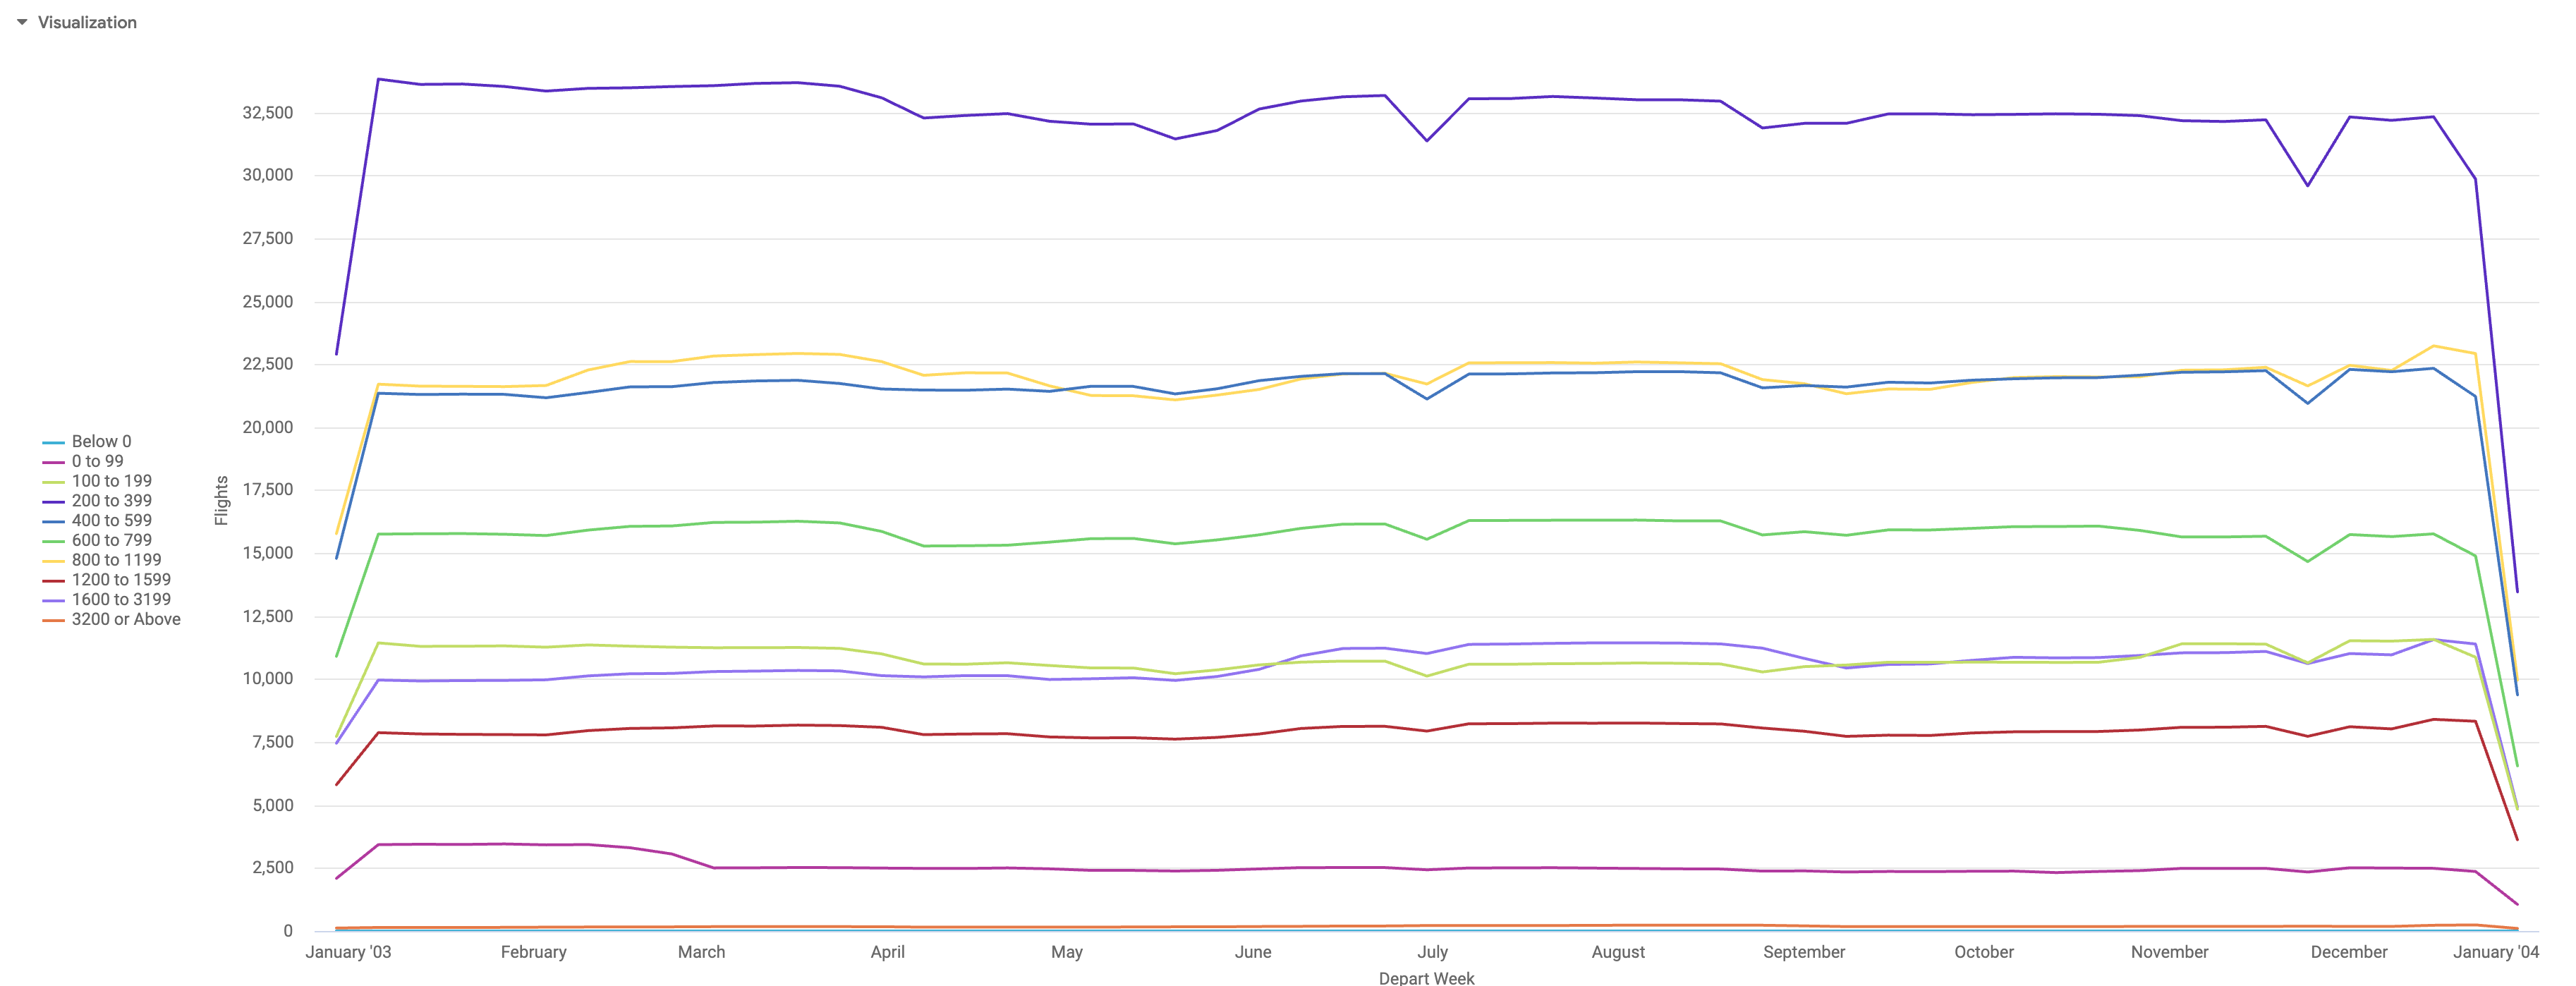
Multiple dimensions are often easier to look at when you pivot one of the dimensions horizontally. Each value in the dimension will become a column in your Look. This makes the information easier to consume visually, and reduces the need to scroll down to find data. Looker supports up to 200 pivoted values.
In this section, you will find the number of flights scheduled to depart in each week of the year 2003. You will then pivot the Distance Tiered dimension and display the result as a line chart.
-
In the Looker navigation menu, click Explore.
-
Under FAA, click Flights.
-
Under Flights > Measures, click Count.
-
Under Flights > Dimensions > Depart Date, click Week.
-
Within the Depart Date dimension group, click on the Filter button next to the Date dimension.
-
In the filter window, set the Depart Date filter to:
is in the year 2003. -
Click Run.
-
Under Flights > Dimensions, click on the Pivot data button for Distance Tiered.
-
Click Run.
If there is no row of data whose value would appear in a column, that is indicated with the null value symbol, a zero with a slash across. For example, the Below Zero column has all null values.
You can also sort pivoted dimensions by clicking the title of the dimension. To sort by multiple pivoted dimensions, hold down the Shift key and then click on the dimension titles in the order you would like them sorted. When you’re sorting a pivoted measure, any rows with values in that column are sorted first, followed by rows without data in that column (indicated by the null value symbol).
-
Click the arrow next to Visualization to expand the window.
-
Once the Visualization window has expanded, hover your cursor over the icons to identify the available options.
-
Change visualization type to Line.
-
Click on the settings gear icon for Visualization.
-
Click Edit > Plot.
-
Select the Legend Align as Left.
-
Click on the gear icon for Visualization to close the settings.
-
Click on the settings gear icon next to Run, and select Save > As a Look.
-
Title the Look Flight Count by Departure Week and Distance Tier.
-
Click Save.
Click Check my progress to verify the objective.
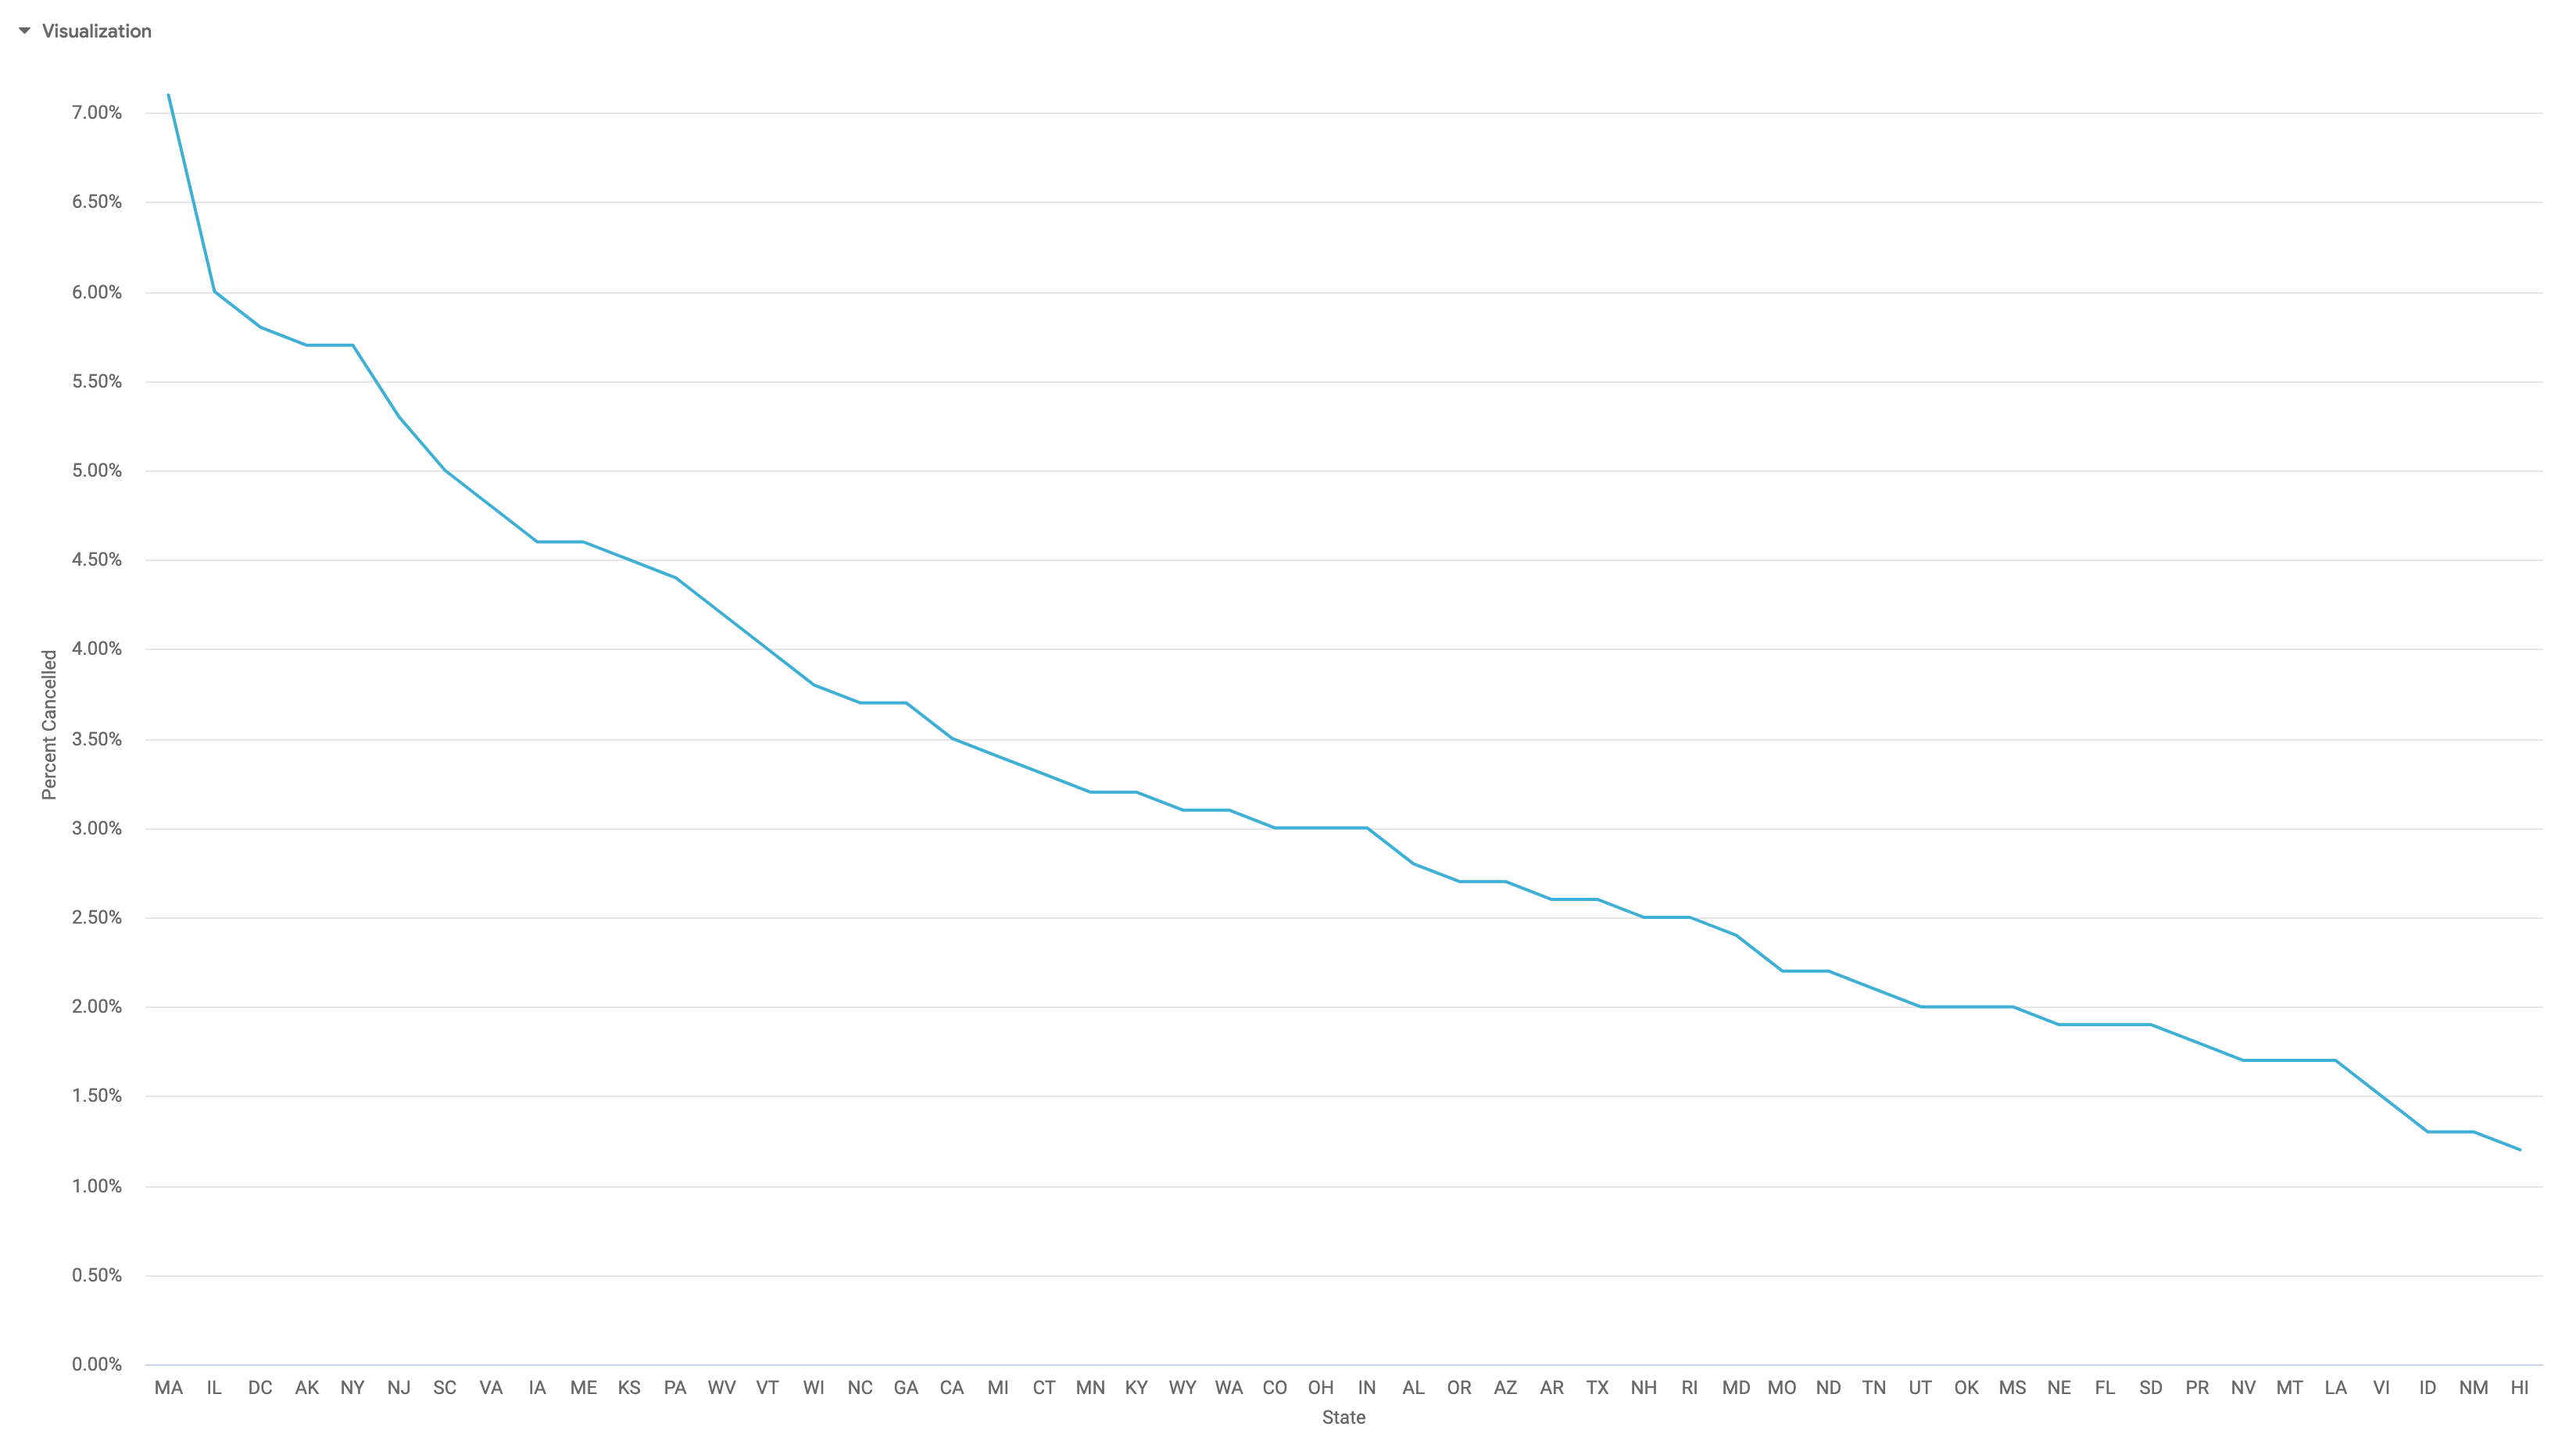
Task 2. Reorder columns and remove fields
You can reorder columns in the Data section by clicking on a column header and moving the column to its desired position. The Explore’s visualization will reflect the new column order after you click Run.
Columns are organized in the Data section by field type: dimensions, dimension table calculations, measures, measure table calculations, and row totals.
For the most part, columns can be reordered within each field type but cannot be moved out of their field type section. For example, dimension table calculations can be rearranged among themselves, but you cannot place a dimension table calculation in between two measures.
One exception, however, is that you can use the arrow next to the row totals checkbox on the Data tab to move the row total column from the far right of the data table to just after the dimension table calculations.
Columns under a pivoted dimension can be reordered, but the order of pivoted dimensions can be changed only by changing the sort order, not by manual reordering.
-
In the Looker navigation menu, click Explore.
-
Under FAA, click Flights.
-
Under Flights > Measures, click Percent Cancelled.
-
Under Flights > Dimensions > Depart Date, click Month.
-
Within the Depart Date dimension group, click on the Filter button next to the Date dimension.
-
In the filter window, set the Depart Date filter to:
is in the year 2000. -
Under Aircraft Origin > Dimensions, click State.
-
Click Run.
-
Click the Percent Cancelled column header to reorder the percentage from high to low.
-
Hover over the Depart Month column, and click the gear icon that appears on the right side.
-
Click Remove.
-
Once the column is removed from the Data section, click Run again.
-
Click on the settings gear icon next to Run, and select Save > As a Look.
-
Title the Look Percent of Flights Cancelled by State in 2000.
-
Click Save.
Click Check my progress to verify the objective.
Task 3. Use table calculations to calculate simple percentages
Table calculations make it easy to create on-the-fly metrics. They are similar to formulas found in spreadsheet tools like Excel. Table calculations appear as green columns in the data table, rather than as blue columns (dimensions) or orange columns (measures).
Table calculations can perform mathematical, logical (true/false), lexical (text-based), and date-based calculations on the dimensions, measures, and other table calculations in your query. The formulas that you use to execute these calculations are called Looker expressions.
Table calculations are different from regular fields
Although table calculations are similar to dimensions and measures, there are some important differences:
- Table calculations give anyone the ability to create new fields, as opposed to regular fields, which require that you have development permissions and understand LookML.
- Table calculations operate on the results from your query, as opposed to regular fields, which are part of the query itself. In other words, you’ll select a set of dimensions and measures and run your report as normal, then you can base table calculations on the data in that report.
- Although table calculations are easier to create than regular fields, they are not as easily controlled as regular fields. Since they can be created by anyone within your organization, they might not be the “official” calculations. Keep this tradeoff in mind as you decide between regular fields and table calculations, since one of the key advantages of Looker is having a single source of truth!
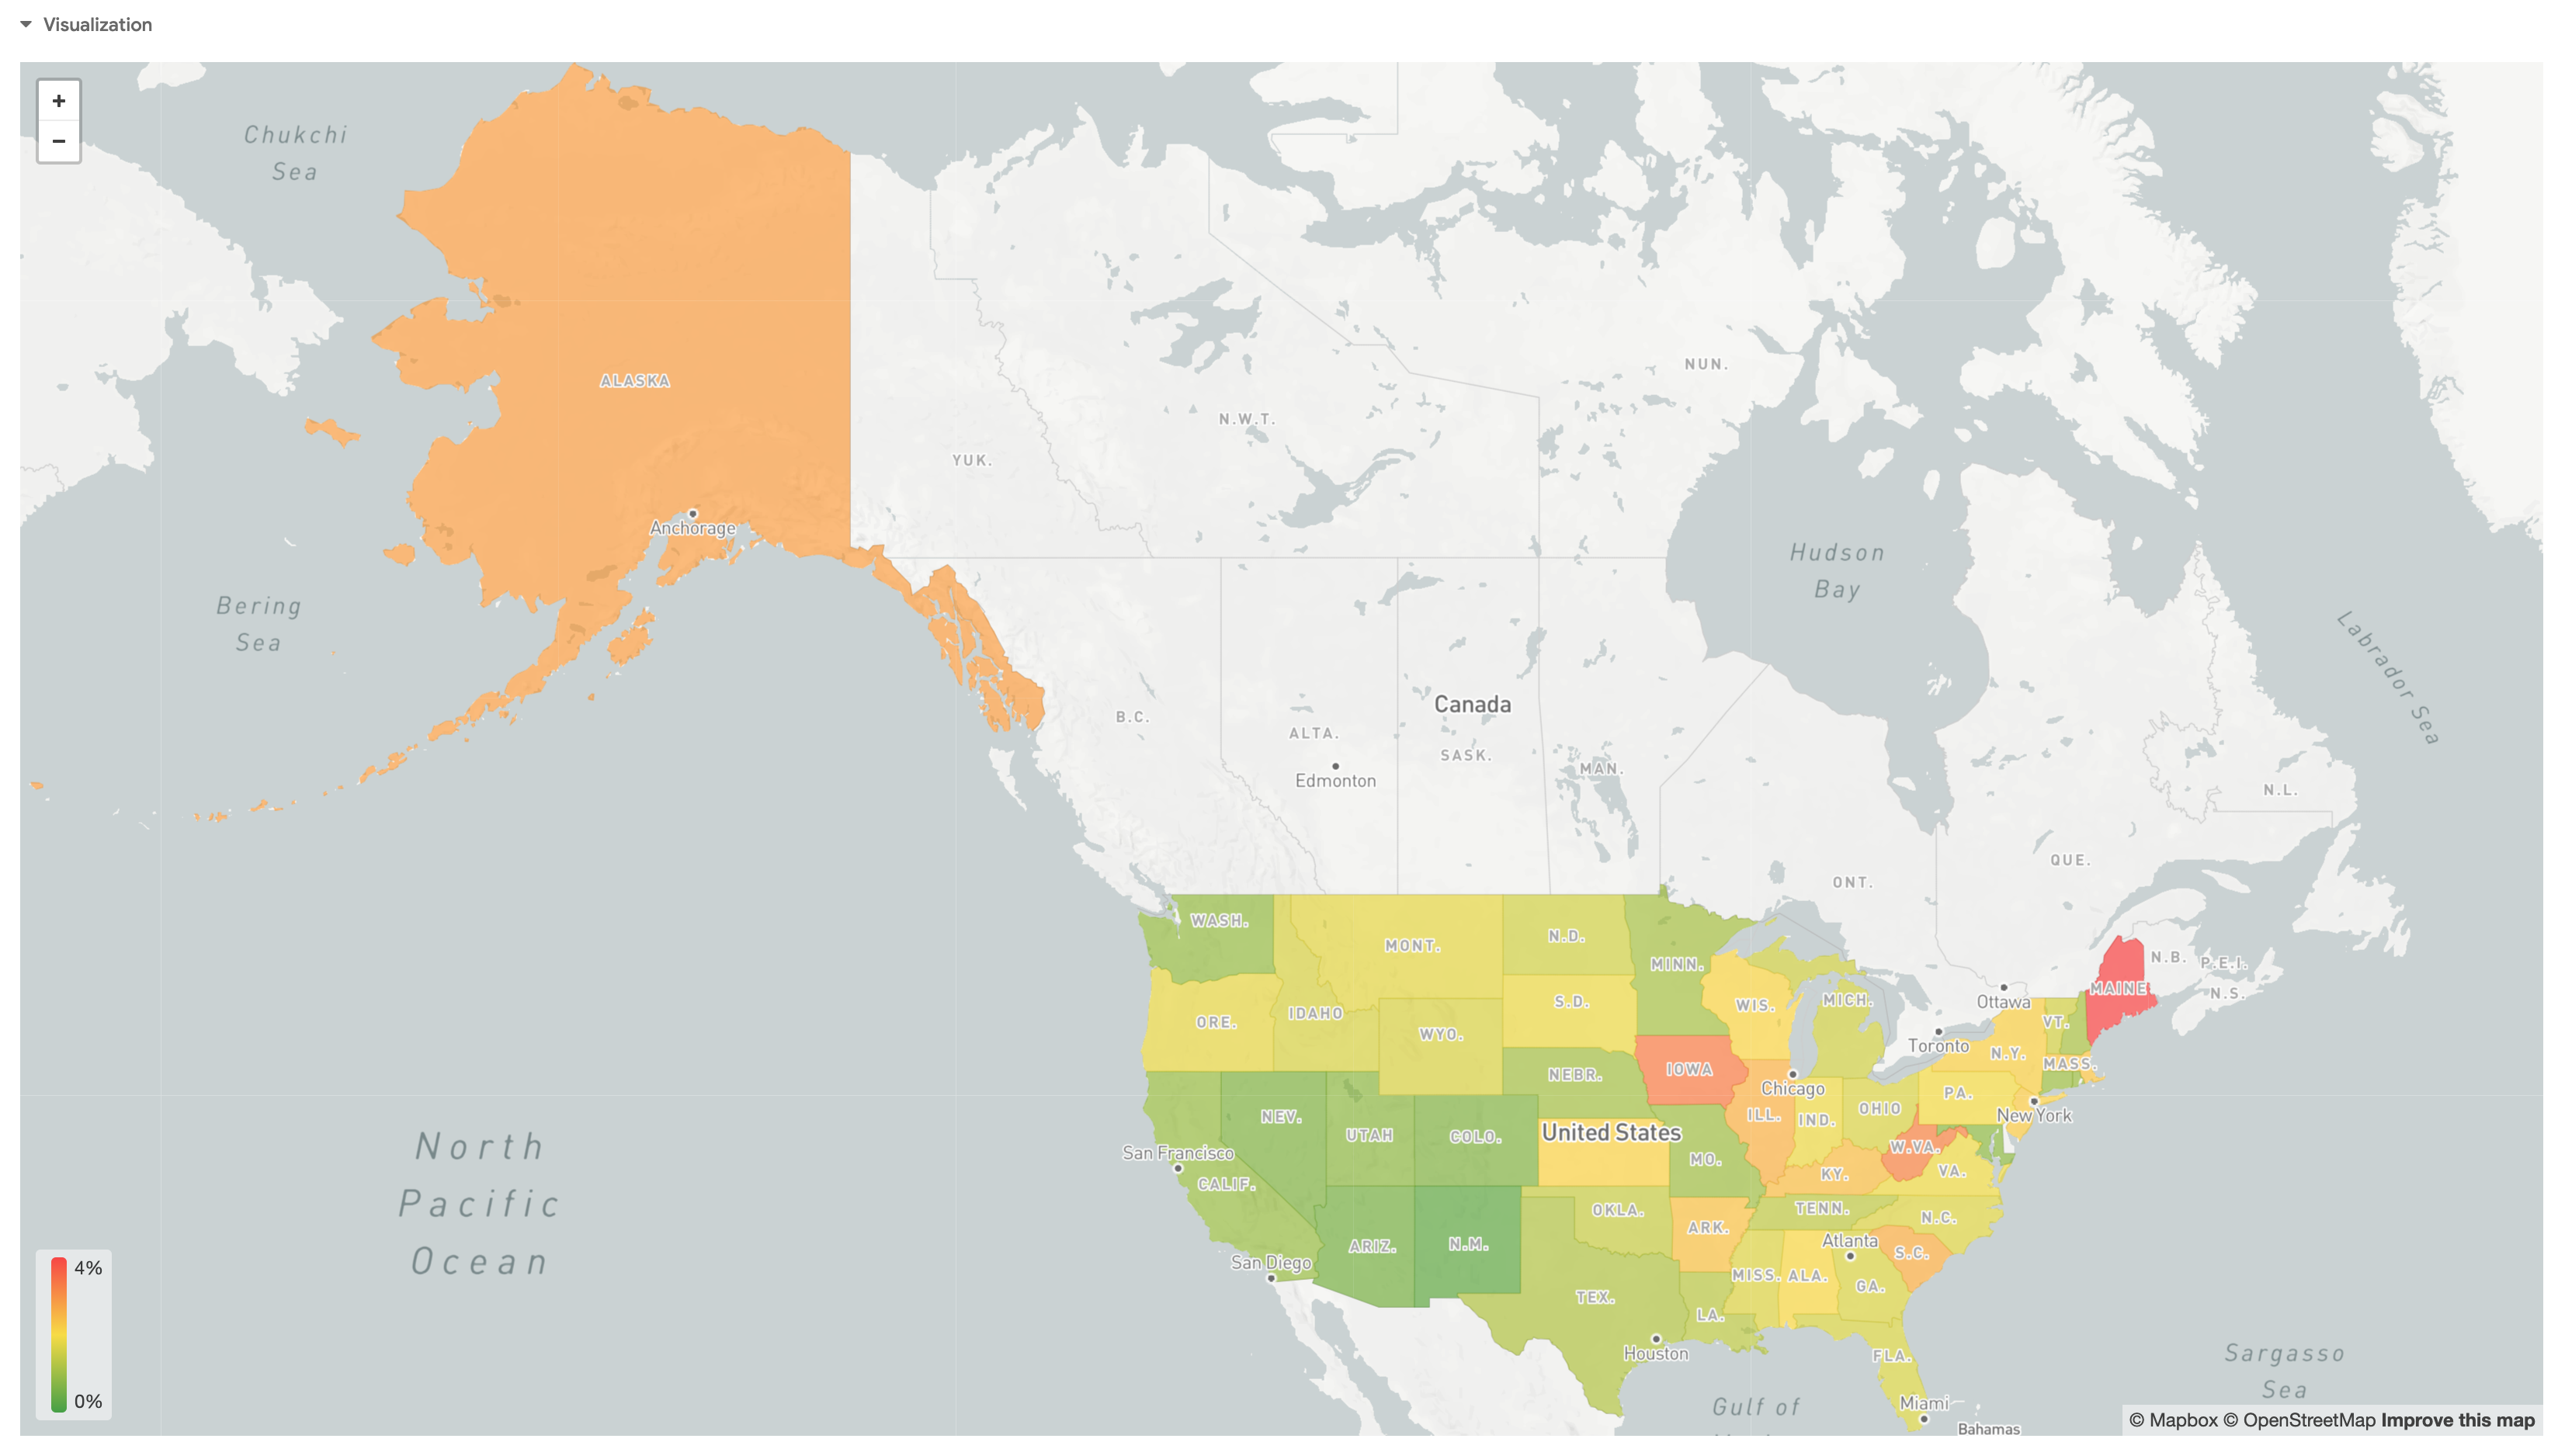
Create a map visualization
In this section, you will create a map that shows the % of Flights Cancelled by Aircraft Origin State for the year 2004.
-
In the Looker navigation menu, click Explore.
-
Under FAA, click Flights.
-
Under Flights Details > Measures, click Cancelled Count.
-
Under Flights > Measures, click Count.
-
Under Aircraft Origin > Dimensions, click State.
-
Under Flights, within the Depart Date dimension group, click on the Filter button next to the Date dimension.
-
In the filter window, set the Depart Date filter to:
is in the year 2004. -
Click Run.
Create a table calculation
- Next to Custom Fields, click + Add. Select Table Calculation.
In the Table Calculations pop-up window, you can start constructing your custom metrics. The expression you create can evaluate to a number, date, string (text), or Boolean (true/false).
- If you already have some table calculations defined, click the Add Table Calculation button to create another. You are able to add as many table calculations as you need.
For each table calculation:
- Rename your table calculation if desired.
- Optionally, click Default Formatting to choose a predefined format or create a custom format for the results. If you create a custom format, use Excel-style formatting as described on the Adding custom formatting to numeric fields documentation page.
- Start typing a Looker expression into the large text box to form your calculation. Looker expressions can be quite simple, or they can use as many fields, functions, and operators as your business logic requires. The Creating Looker expressions documentation page explains how to create Looker expressions and how the editor helps you.
- When you are finished adding table calculations, click Save.
- In the Expression field, add the following Table Calculation:
-
Click Default Formatting to change the format to
Percent (0). -
Rename the Table Calculation to "Percent Cancelled".
-
Click Save.
-
Hover over the Cancelled Count column, and click the gear icon that appears on the right side.
-
Click Hide from Visualization.
-
Repeat the same process to hide the Count column from the Visualization.
-
Click the arrow next to Visualization to expand the window.
-
Change visualization type to Map.
-
Click on the settings gear icon next to Run, and select Save > As a Look.
-
Title the Look Percent of Flights Cancelled by Aircraft Origin 2004
-
Click Save.
Click Check my progress to verify the objective.
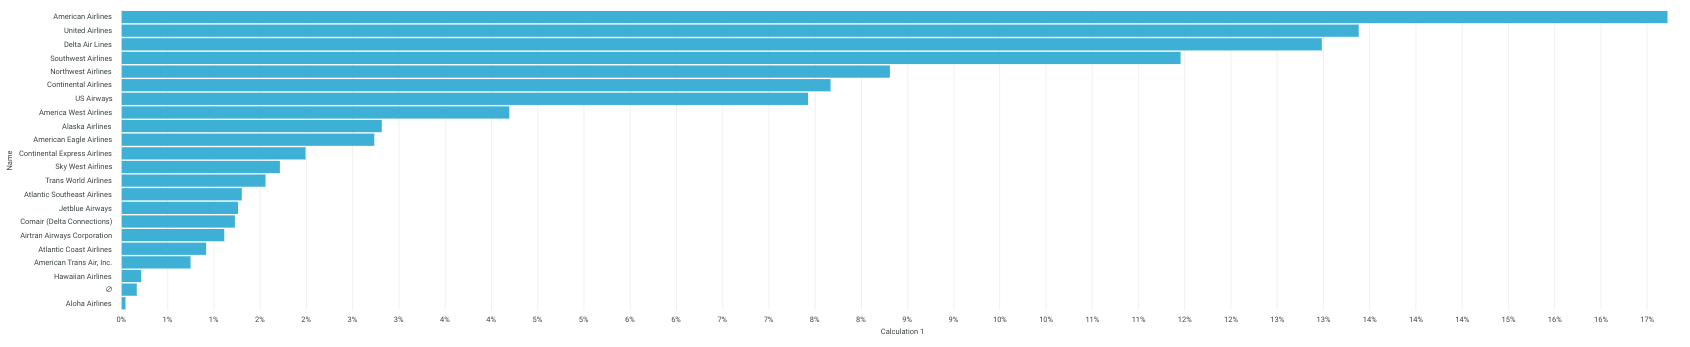
Task 4. Use table calculations to calculate percentages of a total
In this section, you will create a Bar Chart that shows the percent of Total Distance Flown by Carrier.
-
In the Looker navigation menu, click Explore.
-
Under FAA, click Flights.
-
Under Flights > Measures, click Total Distance.
-
Under Carriers > Dimensions, click Name.
-
In the Data bar, click on the Totals checkbox next to Row Limit.
-
Click Run.
-
Next to Custom Fields, click + Add. Select Table Calculation.
-
Add the following in Expression field:
-
Click Default Formatting to change the format to
Percent (0). -
Click Save.
-
Hover over the Total Distance column, and click the gear icon that appears on the right side.
-
Click Hide from Visualization.
-
Click Run.
-
Click the arrow next to Visualization to expand the window.
-
Change visualization type to Bar.
-
Click on the settings gear icon next to Run, and select Save > As a Look.
-
Title the Look Percent of Total Distance Flown by Carrier
-
Click Save.
Click Check my progress to verify the objective.
Task 5. Use functions in table calculations
Looker expressions (sometimes referred to as Lexp) are used to perform calculations for:
- Table calculations (which include expressions used in data tests)
- Custom fields
- Custom filters
A major part of these expressions is the functions and operators that you can use in them. The functions and operators can be divided into a few basic categories:
- Mathematical: Number-related functions
- String: Word- and letter-related functions
- Dates: Date- and time-related functions
- Logical transformation: Includes boolean (true or false) functions and comparison operators
- Positional transformation: Retrieving values from different rows or pivots
Some functions are only available for table calculations
Looker expressions for custom filters and custom fields do not support Looker functions that convert datatypes, aggregate data from multiple rows, or refer to other rows or pivot columns. These functions are supported only for table calculations (including table calculations used in the expression parameter of a data test).
The Looker functions and operators documentation is organized to clarify which functions and operators are available, depending on where you are using your Looker expression.
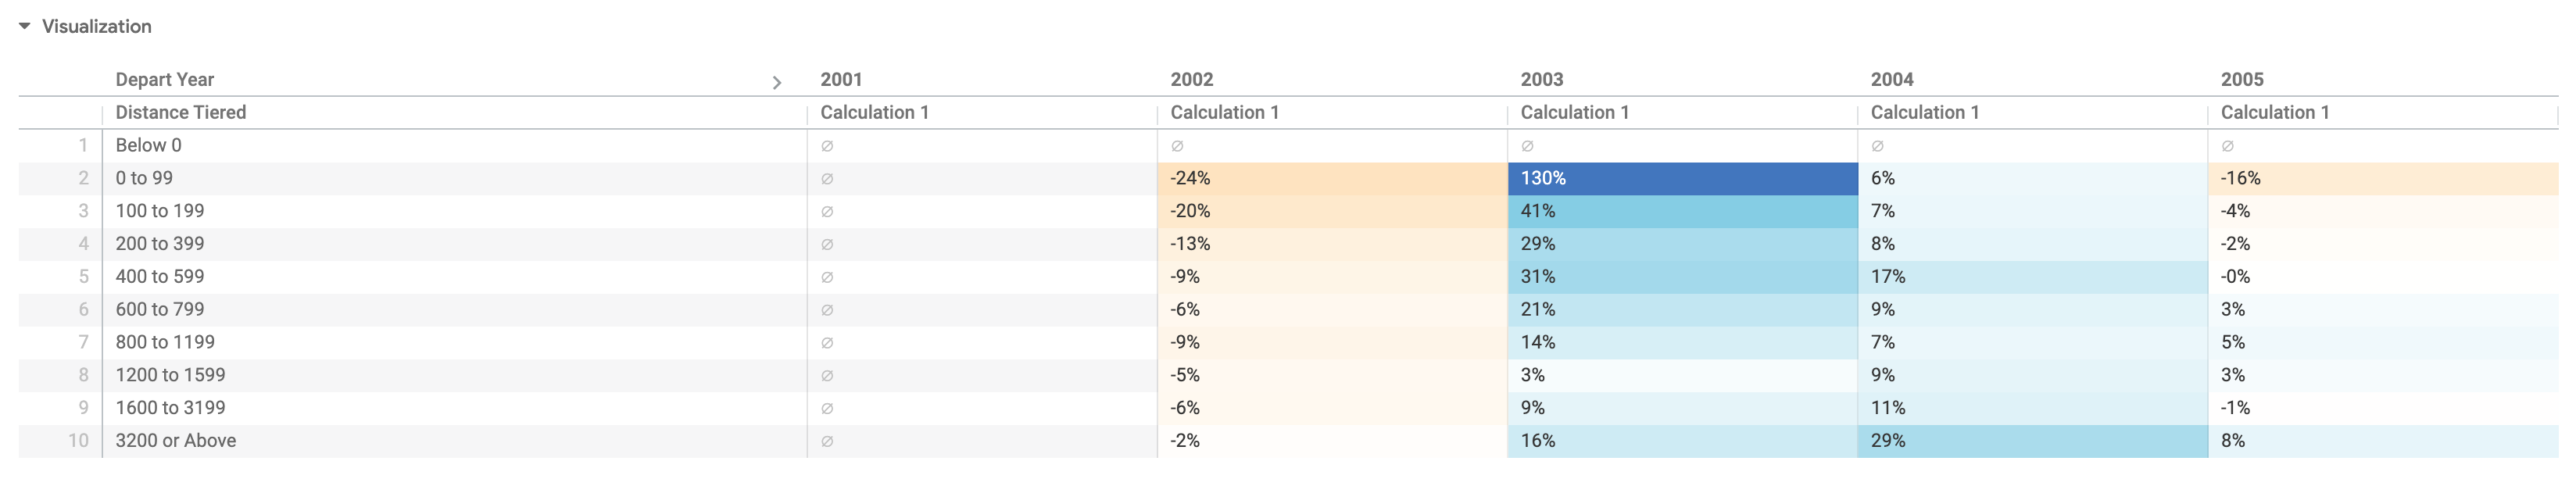
In this section, you will find the Year over Year Percent Change in Flights flown by Flight Distance Tier for all flights departing after January 1, 2000. You will display this as a table, and add conditional formatting.
-
In the Looker navigation menu, click Explore.
-
Under FAA, click Flights.
-
Under Flights > Measures, click Count.
-
Under Flights > Dimensions, click Distance Tiered.
-
Under Flights, within the Depart Date dimension group, click on the Pivot data button next to the Year dimension.
-
Click on the Filter button next to Date.
-
In the filter window, set the Depart Date filter to:
is on or after 01/01/2000. You can leave the defaultabsolute. -
Click Run.
-
Next to Custom Fields, click + Add. Select Table Calculation.
-
Add the following Table Calculation, making use of the
pivot_offsetfunction:
-
Click Default Formatting to change the format to
Percent (0). -
Click Save.
-
Hover over one of the Count columns, and click the gear icon that appears on the right side.
-
Click Hide from Visualization. It should hide all of the Count columns.
-
Click Run.
-
Click the arrow next to Visualization to expand the window.
-
Change visualization type to Table.
-
Click on the settings gear icon for Visualization.
-
Click Edit > Formatting.
-
Toggle the Enable Conditional Formatting to on. Accept the default options and click Add a Rule.
-
Click on the gear icon for Visualization to close the settings.
-
Click on the settings gear icon next to Run, and select Save > As a Look.
-
Title the Look YoY Percent Change in Flights flown by Distance, 2000-Present
-
Click Save.
Click Check my progress to verify the objective.
Congratulations!
In this lab, you learned how to pivot dimensions, reorder columns and remove fields, and use table calculations and functions.
Next steps / Learn more
- Learn more about creating Explores in the Exploring data in Looker documentation.
Google Cloud training and certification
...helps you make the most of Google Cloud technologies. Our classes include technical skills and best practices to help you get up to speed quickly and continue your learning journey. We offer fundamental to advanced level training, with on-demand, live, and virtual options to suit your busy schedule. Certifications help you validate and prove your skill and expertise in Google Cloud technologies.
Manual Last Updated: January 31, 2024
Lab Last Tested: January 20, 2023
Copyright 2024 Google LLC All rights reserved. Google and the Google logo are trademarks of Google LLC. All other company and product names may be trademarks of the respective companies with which they are associated.