Prüfpunkte
Create a new dataset to store the tables
/ 25
Explore the product sentiment dataset
/ 25
Join datasets to find insights
/ 25
Append additional records
/ 25
Creating a Data Warehouse Through Joins and Unions
GSP413

Overview
BigQuery is Google's fully managed, NoOps, low cost analytics database. With BigQuery you can query terabytes and terabytes of data without having any infrastructure to manage or needing a database administrator. BigQuery uses SQL and can take advantage of the pay-as-you-go model. BigQuery allows you to focus on analyzing data to find meaningful insights.
The dataset you'll use is an ecommerce dataset that has millions of Google Analytics records from the Google Merchandise Store. You will explore the available fields and row for insights.
This lab focuses on how to create new reporting tables using SQL JOINS and UNIONs.
Scenario: Your marketing team provided you and your data science team all of the product reviews for your ecommerce website. You are partnering with them to create a data warehouse in BigQuery which joins together data from three sources:
- Website ecommerce data
- Product inventory stock levels and lead times
- Product review sentiment analysis
What you'll do
In this lab, you learn how to perform these tasks:
- Explore new ecommerce data on sentiment analysis.
- Join datasets and create new tables.
- Append historical data with unions and table wildcards.
Setup and requirements
Before you click the Start Lab button
Read these instructions. Labs are timed and you cannot pause them. The timer, which starts when you click Start Lab, shows how long Google Cloud resources will be made available to you.
This hands-on lab lets you do the lab activities yourself in a real cloud environment, not in a simulation or demo environment. It does so by giving you new, temporary credentials that you use to sign in and access Google Cloud for the duration of the lab.
To complete this lab, you need:
- Access to a standard internet browser (Chrome browser recommended).
- Time to complete the lab---remember, once you start, you cannot pause a lab.
How to start your lab and sign in to the Google Cloud console
-
Click the Start Lab button. If you need to pay for the lab, a pop-up opens for you to select your payment method. On the left is the Lab Details panel with the following:
- The Open Google Cloud console button
- Time remaining
- The temporary credentials that you must use for this lab
- Other information, if needed, to step through this lab
-
Click Open Google Cloud console (or right-click and select Open Link in Incognito Window if you are running the Chrome browser).
The lab spins up resources, and then opens another tab that shows the Sign in page.
Tip: Arrange the tabs in separate windows, side-by-side.
Note: If you see the Choose an account dialog, click Use Another Account. -
If necessary, copy the Username below and paste it into the Sign in dialog.
{{{user_0.username | "Username"}}} You can also find the Username in the Lab Details panel.
-
Click Next.
-
Copy the Password below and paste it into the Welcome dialog.
{{{user_0.password | "Password"}}} You can also find the Password in the Lab Details panel.
-
Click Next.
Important: You must use the credentials the lab provides you. Do not use your Google Cloud account credentials. Note: Using your own Google Cloud account for this lab may incur extra charges. -
Click through the subsequent pages:
- Accept the terms and conditions.
- Do not add recovery options or two-factor authentication (because this is a temporary account).
- Do not sign up for free trials.
After a few moments, the Google Cloud console opens in this tab.

Open the BigQuery console
- In the Google Cloud Console, select Navigation menu > BigQuery.
The Welcome to BigQuery in the Cloud Console message box opens. This message box provides a link to the quickstart guide and the release notes.
- Click Done.
The BigQuery console opens.
Task 1. Create a new dataset to store your tables
To get started, create a new dataset titled ecommerce in BigQuery to store your tables.
-
In the left pane, click on the name of your BigQuery project (
qwiklabs-gcp-xxxx). -
Click on the three dots next to your project name, then select Create dataset.
The Create dataset dialog opens.
-
Set the Dataset ID to
ecommerce, leave all other options at their default values. -
Click Create dataset.
Click Check my progress to verify the objective.
Task 2. Explore the product sentiment dataset
Your data science team has run all of your product reviews through the API and provided you with the average sentiment score and magnitude for each of your products.
The project with your marketing team's dataset is data-to-insights. BigQuery public datasets are not displayed by default in BigQuery. The queries in this lab will use the data-to-insights dataset even though you cannot see it.
- First, create a copy of the table that the data science team made so you can read it:
data-to-insights project.- Click on the ecommerce dataset to display the
productstable.
Examine the data using Preview and Schema tabs
- Navigate to the ecommerce > products dataset and click the Preview tab to see the data.
- Click the Schema tab.
Create a query that shows the top 5 products with the most positive sentiment
- In the Query Editor, write your SQL query.
Possible solution:
- Revise your query to show the top 5 products with the most negative sentiment and filter out NULL values.
Possible solution:
What is the product with the lowest sentiment?
Click Check my progress to verify the objective.
Task 3. Join datasets to find insights
Scenario: It's the first of the month and your inventory team has informed you that the orderedQuantity field in the product inventory dataset is out of date. They need your help to query the total sales by product for 08/01/2017 and reference that against the current stock levels in inventory to see which products need to be resupplied first.
Calculate daily sales volume by productSKU
- Create a new table in your ecommerce dataset with the below requirements:
- Title it
sales_by_sku_20170801 - Source the data from
data-to-insights.ecommerce.all_sessions_raw - Include only distinct results
- Return
productSKU - Return the total quantity ordered (
productQuantity). Hint: Use aSUM() with a IFNULLcondition - Filter for only sales on
20170801 -
ORDER BYthe SKUs with the most orders first
Possible solution:
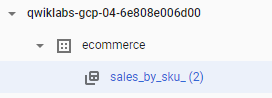
- Click on the
sales_by_skutable, then click the Preview tab.
How many distinct product SKUs were sold?
Answer: 462
Next, enrich your sales data with product inventory information by joining the two datasets.
Join sales data and inventory data
- Using a JOIN, enrich the website ecommerce data with the following fields from the product inventory dataset:
namestockLevelrestockingLeadTimesentimentScoresentimentMagnitude
- Complete the partially written query:
Possible solution:
- Modify the query you wrote to now include:
- A calculated field of (
total_ordered / stockLevel) and alias it "ratio". Hint: UseSAFE_DIVIDE(field1,field2)to avoid dividing by 0 errors when the stock level is 0. - Filter the results to only include products that have gone through 50% or more of their inventory already at the beginning of the month
Possible solution:
Click Check my progress to verify the objective.
Task 4. Append additional records
Your international team has already made in-store sales on 08/02/2017 which you want to record in your daily sales tables.
Create a new empty table to store sales by productSKU for 08/02/2017
- For the schema, specify the following fields:
- table name is
ecommerce.sales_by_sku_20170802 productSKU STRING-
total_orderedas anINT64field
Possible solution:
- Confirm you now have two date-shared sales tables - use the dropdown menu next to the Sales_by_sku table name in the table results, or refresh your browser to see it listed in the left menu:
- Insert the sales record provided to you by your sales team:
- Confirm the record appears by previewing the table - click on the table name to see the results.
Append together historical data
There are multiple ways to append together data that has the same schema. Two common ways are using UNIONs and table wildcards.
- Union is an SQL operator that appends together rows from different result sets.
- Table wildcards enable you to query multiple tables using concise SQL statements. Wildcard tables are available only in standard SQL.
- Write a UNION query that will result in all records from the below two tables:
ecommerce.sales_by_sku_20170801ecommerce.sales_by_sku_20170802
UNION and UNION ALL is that a UNION will not include duplicate records.What is a pitfall of having many daily sales tables? You will have to write many UNION statements chained together.
A better solution is to use the table wildcard filter and _TABLE_SUFFIX filter.
- Write a query that uses the (*) table wildcard to select all records from
ecommerce.sales_by_sku_for the year 2017.
Possible solution:
- Modify the previous query to add a filter to limit the results to just 08/02/2017.
Possible solution:
Click Check my progress to verify the objective.
Congratulations!
You explored sample ecommerce data by creating reporting tables and then manipulating views using SQL JOINs and UNIONs.
Next steps / Learn more
- Have a Google Analytics account and want to query your own datasets in BigQuery? Follow this export guide.
- If you want to review more about SQL syntax for JOINS, check out the BigQuery JOIN documentation.
- Try Google Dataset Search as a resource!
- Check out these other labs:
Google Cloud training and certification
...helps you make the most of Google Cloud technologies. Our classes include technical skills and best practices to help you get up to speed quickly and continue your learning journey. We offer fundamental to advanced level training, with on-demand, live, and virtual options to suit your busy schedule. Certifications help you validate and prove your skill and expertise in Google Cloud technologies.
Manual Last Updated February 3, 2024
Lab Last Tested October 31, 2023
Copyright 2024 Google LLC All rights reserved. Google and the Google logo are trademarks of Google LLC. All other company and product names may be trademarks of the respective companies with which they are associated.