Checkpoints
Run Cloud Dataprep jobs to BigQuery
/ 100
Creating a Data Transformation Pipeline with Cloud Dataprep
- GSP430
- Overview
- Setup and requirements
- Task 1. Open Dataprep in the Google Cloud console
- Task 2. Creating a BigQuery dataset
- Task 3. Connecting BigQuery data to Cloud Dataprep
- Task 4. Exploring ecommerce data fields with the UI
- Task 5. Cleaning the data
- Task 6. Enriching the data
- Task 7. Running Cloud Dataprep jobs to BigQuery
- Congratulations!
This lab was developed with our partner, Alteryx. Your personal information may be shared with Alteryx, the lab sponsor, if you have opted-in to receive product updates, announcements, and offers in your Account Profile.
GSP430

Overview
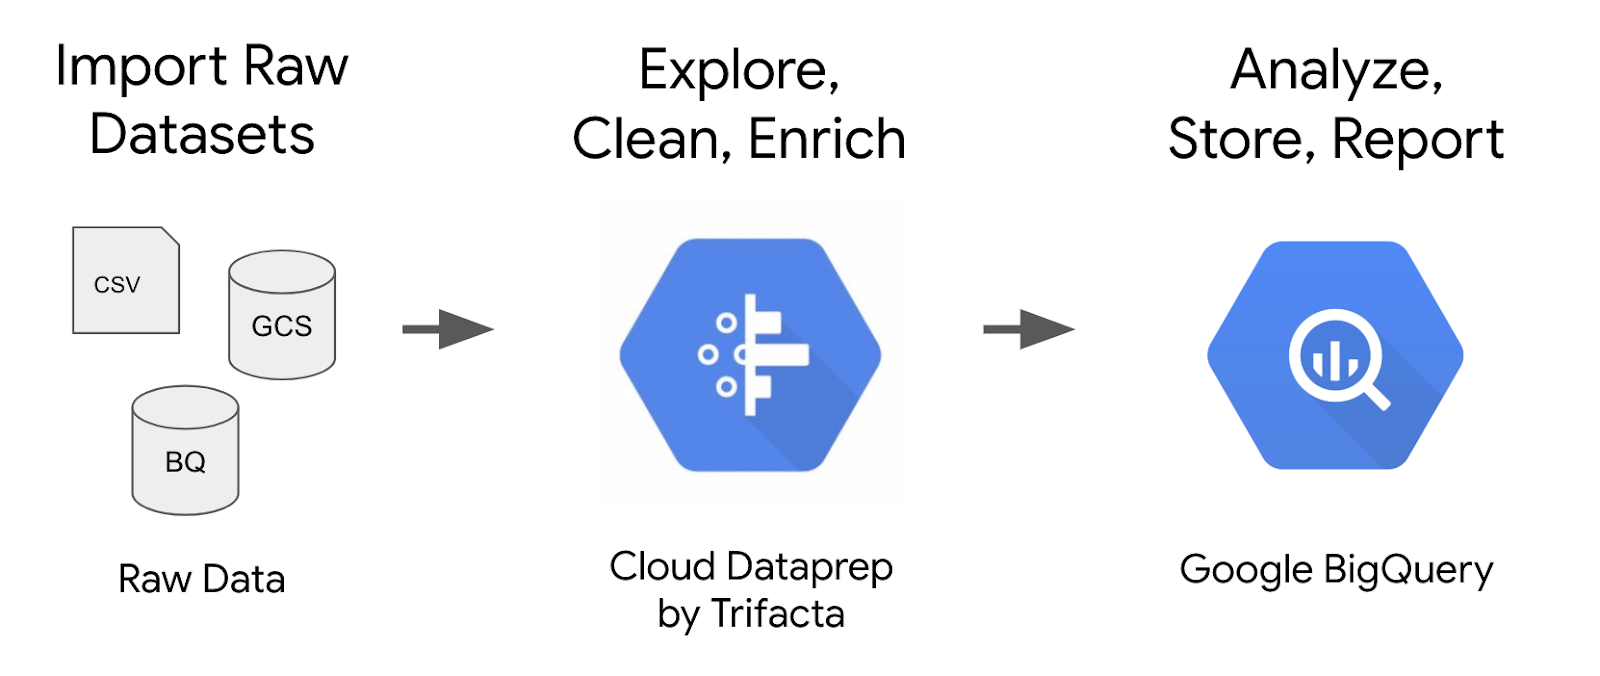
Dataprep by Trifacta is an intelligent data service for visually exploring, cleaning, and preparing structured and unstructured data for analysis. In this lab, you explore the Dataprep user interface (UI) to build a data transformation pipeline that outputs results into BigQuery.
The dataset for this lab is an ecommerce dataset that has millions of Google Analytics session records for the Google Merchandise Store loaded into BigQuery. In the lab, you explore the available fields and rows and prepare the data for analysis.
What you'll do
In this lab, you learn how to perform these tasks:
- Connect BigQuery datasets to Dataprep
- Explore dataset quality with Dataprep
- Create a data transformation pipeline with Dataprep
- Run transformation jobs and send outputs to BigQuery
Setup and requirements
It is recommended that you take the Working with Cloud Dataprep on Google Cloud lab before attempting this lab.
Before you click the Start Lab button
Read these instructions. Labs are timed and you cannot pause them. The timer, which starts when you click Start Lab, shows how long Google Cloud resources will be made available to you.
This hands-on lab lets you do the lab activities yourself in a real cloud environment, not in a simulation or demo environment. It does so by giving you new, temporary credentials that you use to sign in and access Google Cloud for the duration of the lab.
To complete this lab, you need:
- Access to a standard internet browser (Chrome browser recommended).
- Time to complete the lab---remember, once you start, you cannot pause a lab.
How to start your lab and sign in to the Google Cloud console
-
Click the Start Lab button. If you need to pay for the lab, a pop-up opens for you to select your payment method. On the left is the Lab Details panel with the following:
- The Open Google Cloud console button
- Time remaining
- The temporary credentials that you must use for this lab
- Other information, if needed, to step through this lab
-
Click Open Google Cloud console (or right-click and select Open Link in Incognito Window if you are running the Chrome browser).
The lab spins up resources, and then opens another tab that shows the Sign in page.
Tip: Arrange the tabs in separate windows, side-by-side.
Note: If you see the Choose an account dialog, click Use Another Account. -
If necessary, copy the Username below and paste it into the Sign in dialog.
{{{user_0.username | "Username"}}} You can also find the Username in the Lab Details panel.
-
Click Next.
-
Copy the Password below and paste it into the Welcome dialog.
{{{user_0.password | "Password"}}} You can also find the Password in the Lab Details panel.
-
Click Next.
Important: You must use the credentials the lab provides you. Do not use your Google Cloud account credentials. Note: Using your own Google Cloud account for this lab may incur extra charges. -
Click through the subsequent pages:
- Accept the terms and conditions.
- Do not add recovery options or two-factor authentication (because this is a temporary account).
- Do not sign up for free trials.
After a few moments, the Google Cloud console opens in this tab.

Task 1. Open Dataprep in the Google Cloud console
- Open Cloud Shell and run the following command:
You should see a message saying the service identity was created.
-
In the Cloud console, go to the Navigation menu, and under Analytics select Dataprep.
-
To get into Dataprep, check that you agree to Google Dataprep Terms of Service, and then click Accept.
-
Click the checkbox and then click Agree and Continue when prompted to share account information with Alteryx.
-
Click Allow to give Alteryx access to your project.
-
Select your Qwiklabs credentials to sign in and click Allow.
-
Check the box and click Accept to agree to Alteryx Terms of Service.
-
If prompted to use the default location for the storage bucket, click Continue.
Task 2. Creating a BigQuery dataset
Although this lab is largely focused on Cloud Dataprep, you need BigQuery as an endpoint for dataset ingestion to the pipeline and as a destination for the output when the pipeline is completed.
-
In the Cloud Console, select Navigation menu > BigQuery.
-
The Welcome to BigQuery in the Cloud Console message box opens. This message box provides a link to the quickstart guide and lists UI updates.
-
Click Done.
-
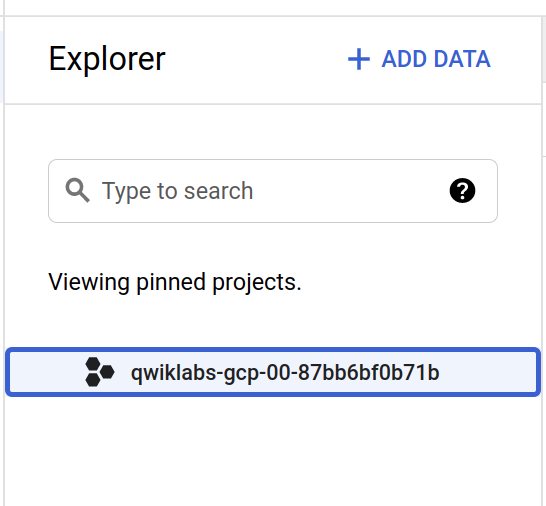
In the Explorer pane, select your project name:
- In the left pane, under Explorer section, click on the View actions icon (
) to the right of your project ID, then click Create dataset.
- For Dataset ID, type
ecommerce. - Leave the other values at their defaults.
-
Click CREATE DATASET. You will now see your dataset under your project in the left pane.
-
Copy and paste the following SQL query into the Query Editor:
-
Click RUN. This query copies over a subset of the public raw ecommerce dataset (one day's worth of session data, or about 56 thousand records) into a new table named
all_sessions_raw_dataprep, which has been added to your ecommerce dataset for you to explore and clean in Cloud Dataprep. -
Confirm that the new table exists in your
ecommercedataset:
Task 3. Connecting BigQuery data to Cloud Dataprep
In this task, you will connect Cloud Dataprep to your BigQuery data source. On the Cloud Dataprep page:
-
Click Create a flow in the right corner.
-
Rename the Untitled Flow and specify these details:
- For Flow Name, type
Ecommerce Analytics Pipeline - For Flow Description, type
Revenue reporting table
-
Click Ok.
-
If prompted with a
What's a flow?popup, select Don't show me any helpers. -
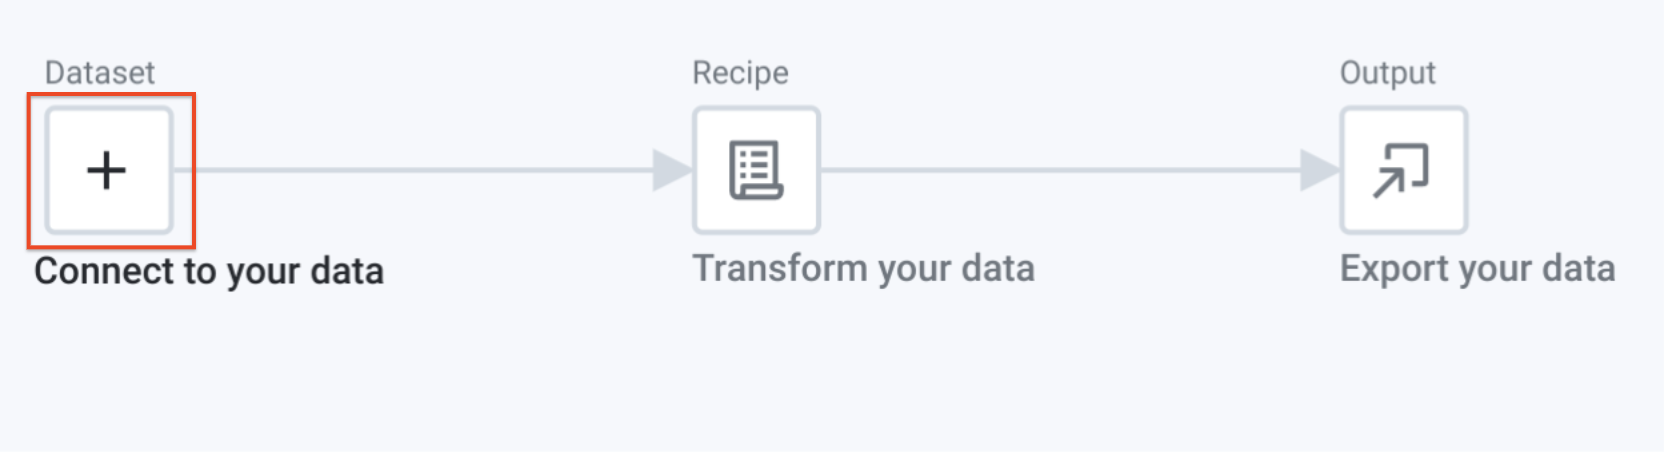
Click the Add Icon in the Dataset box.
-
In the Add Datasets to Flow dialog box, select Import Datasets.
-
In the left pane, click BigQuery.
-
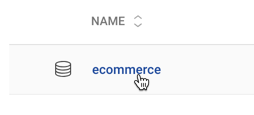
When your ecommerce dataset is loaded, click on it.
-
Click on the Create dataset icon (+ sign) on the left of the
all_sessions_raw_datapreptable. -
Click Import & Add to Flow in the bottom right corner.
The data source automatically updates. You are ready to go to the next task.
Task 4. Exploring ecommerce data fields with the UI
In this task, you will load and explore a sample of the dataset within Cloud Dataprep.
- Click the Recipe icon and then select Edit Recipe.
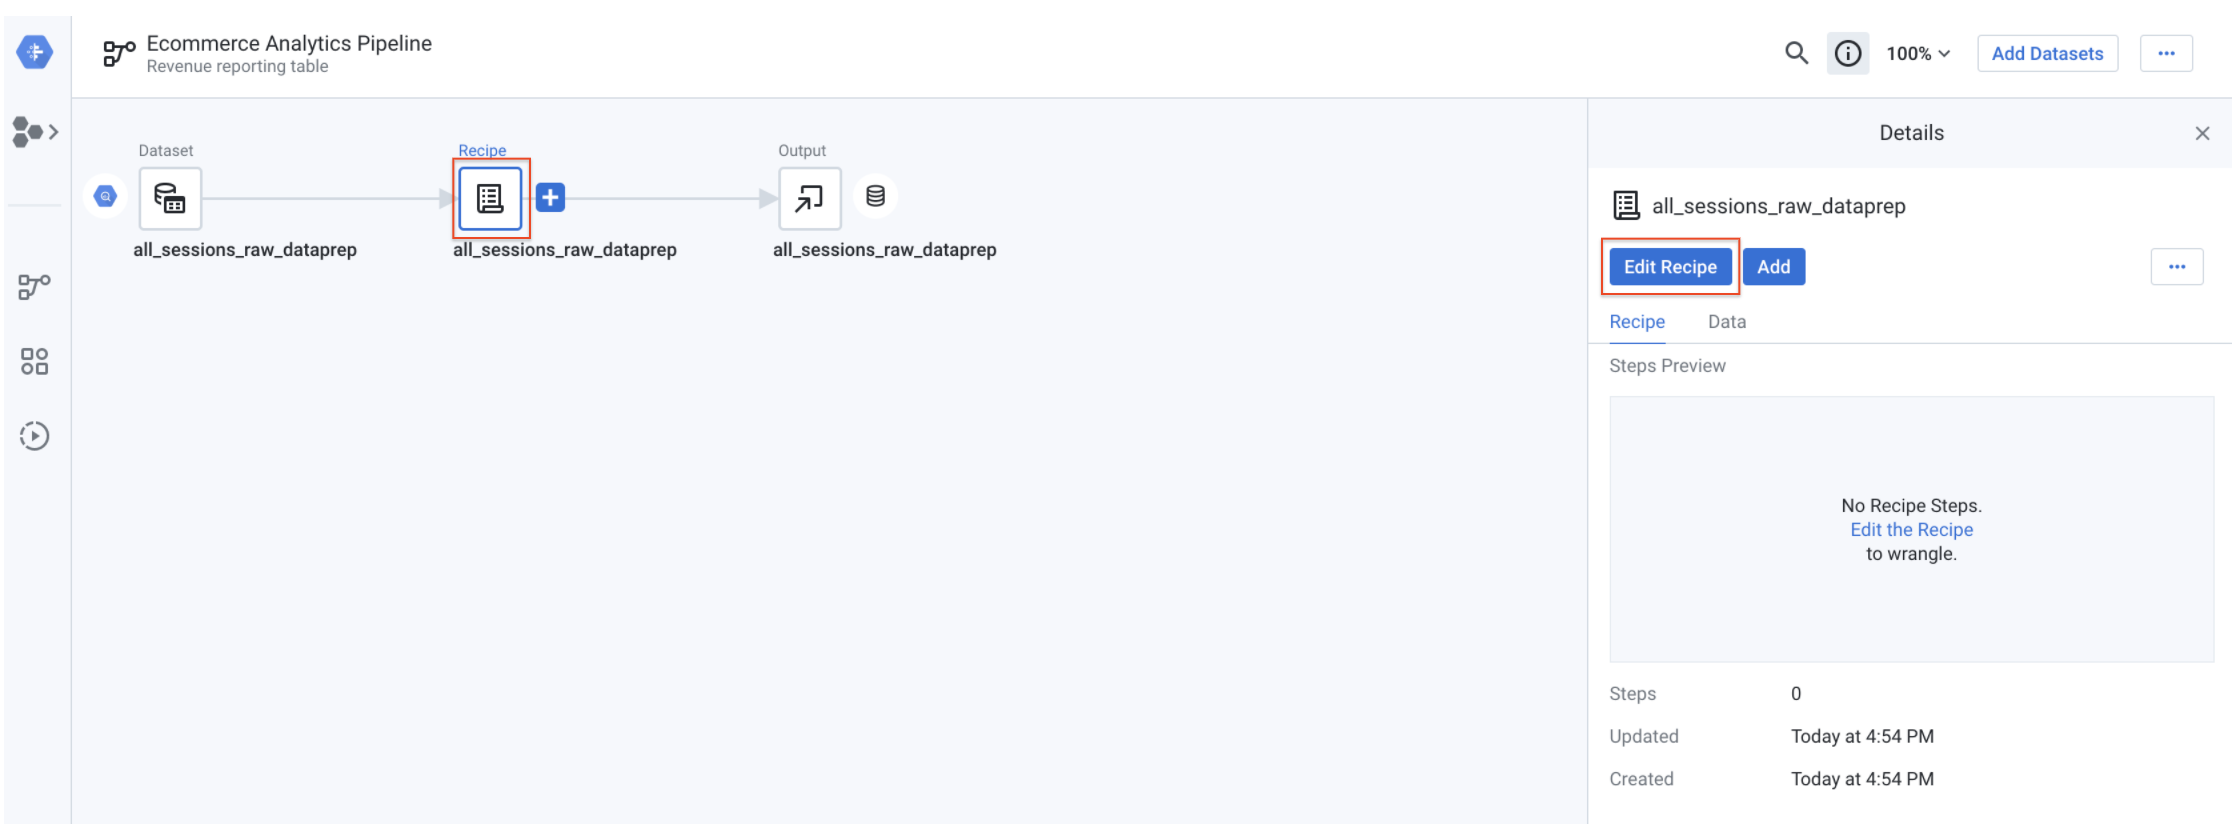
Cloud Dataprep loads a sample of your dataset into the Transformer view. This process might take a few seconds. You are now ready to start exploring the data!
Answer the following questions:
- How many columns are there in the dataset?
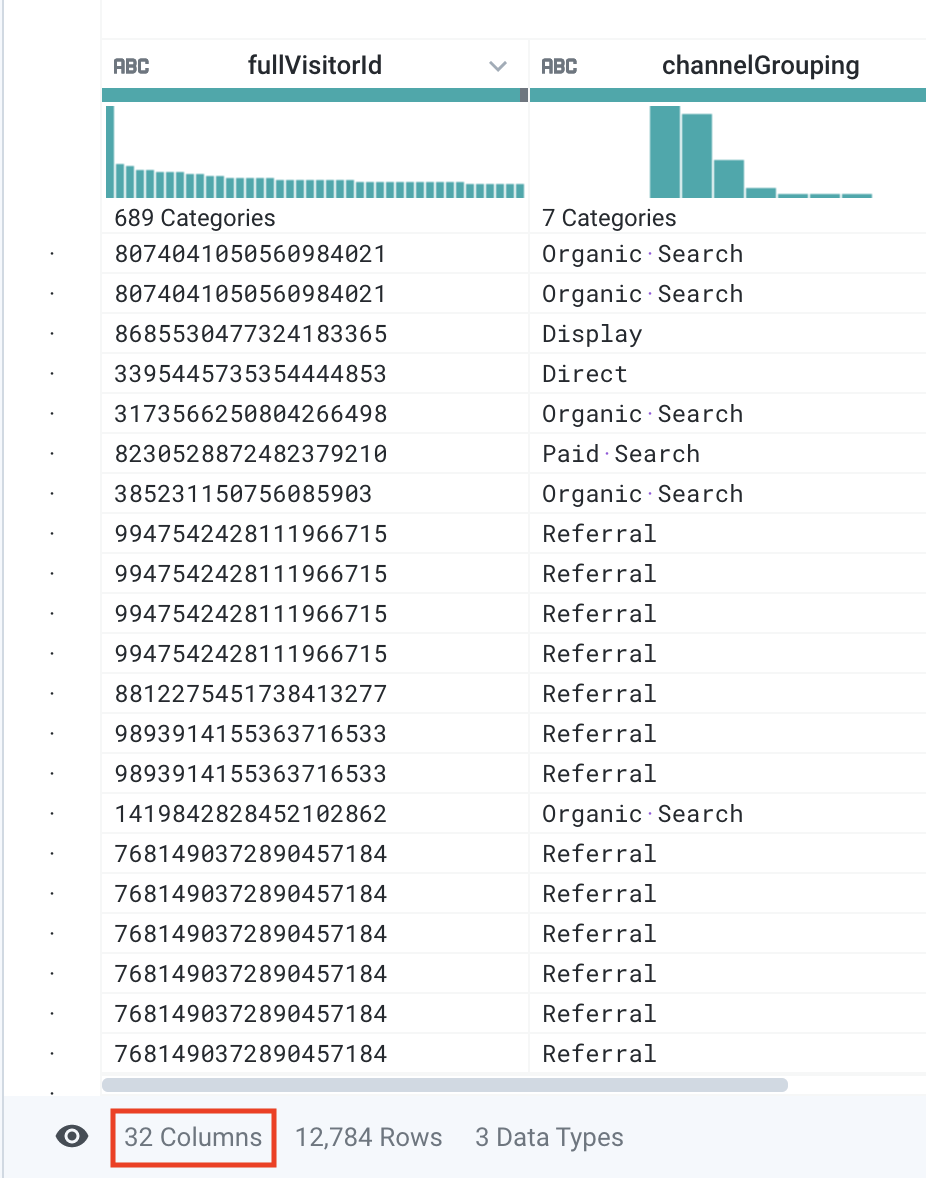
Answer: 32 columns.
- How many rows does the sample contain?
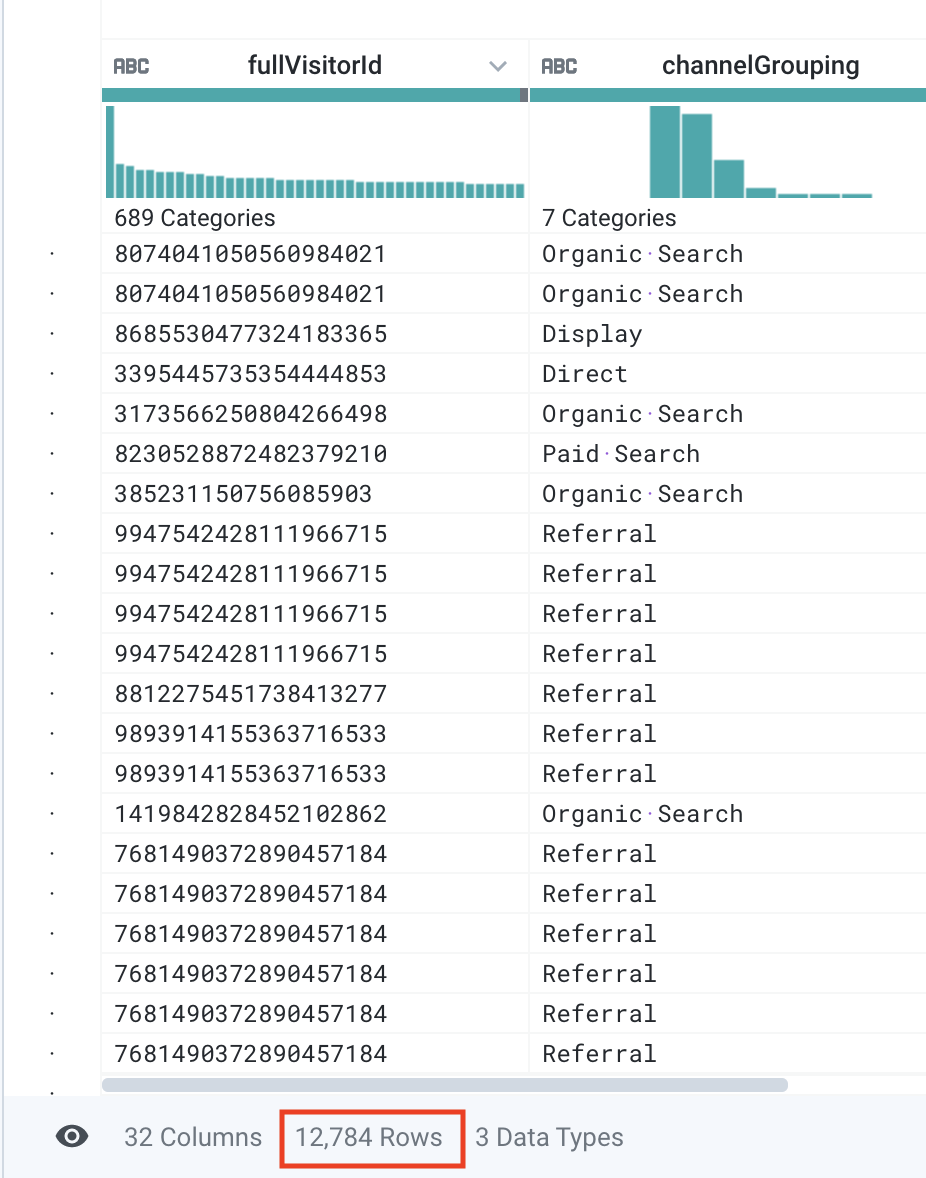
Answer: About 12 thousand rows.
- What is the most common value in the
channelGroupingcolumn?
channelGrouping column title.
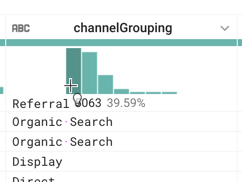
Answer: Referral. A referring site is typically any other website that has a link to your content. An example here is a different website reviewed a product on our ecommerce website and linked to it. This is considered a different acquisition channel than if the visitor came from a search engine.
 ) in the top right corner, then start typing the column's name in the Find column textfield, then click on the column's name. This will automatically scroll the grid to bring the column on the screen.
- What are the top three countries from which sessions are originated?
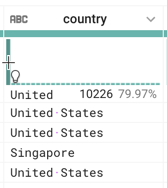
Answer: United States, India, United Kingdom
- What does the grey bar under totalTransactionRevenue represent?
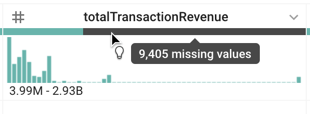
Answer: Missing values for the totalTransactionRevenue field. This means that a lot of sessions in this sample did not generate revenue. Later, we will filter out these values so our final table only has customer transactions and associated revenue.
- What is the maximum
timeOnSitein seconds, maximumpageviews, and maximumsessionQualityDimfor the data sample? (Hint: Open the menu to the right of thetimeOnSitecolumn by clickingthe Column Details menu)
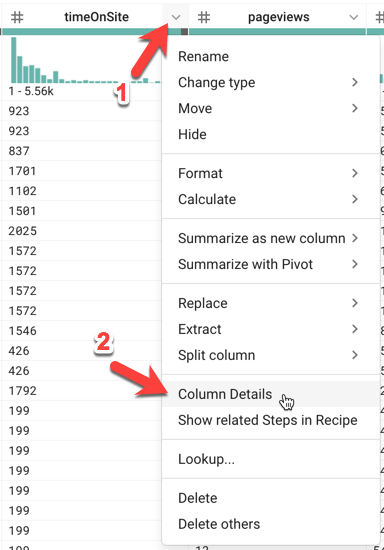
To close the details window, click the Close Column Details (X) button in the top right corner. Then repeat the process to view details for the pageviews and sessionQualityDim columns.
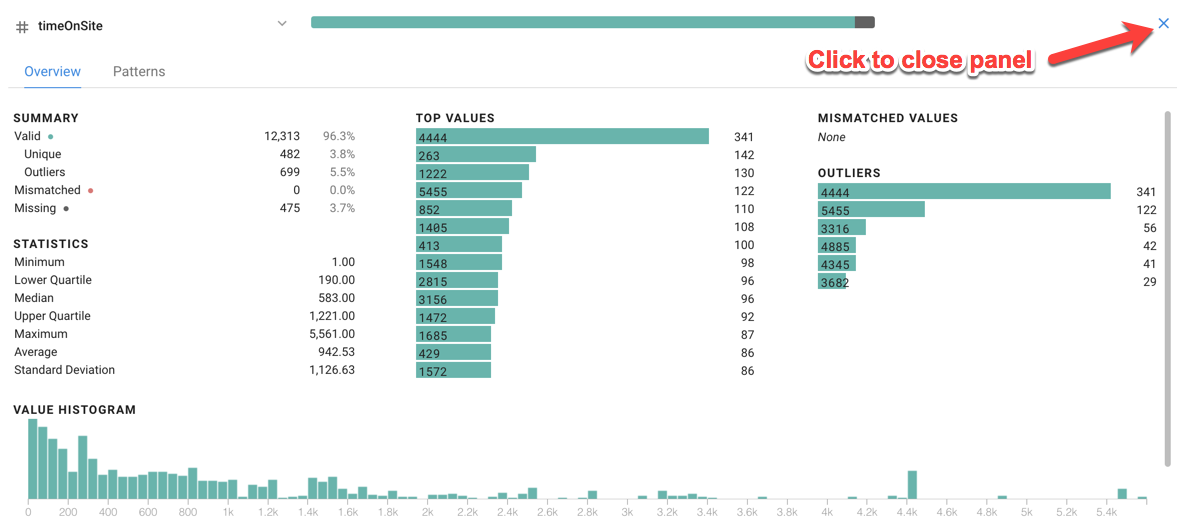
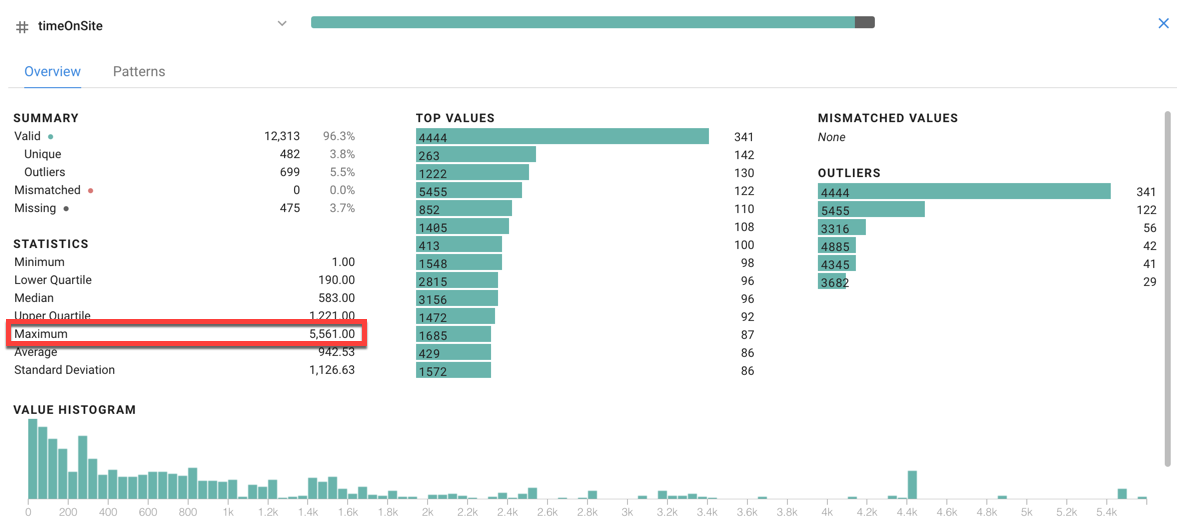
Answers:
- Maximum Time On Site: 5,561 seconds (or 92 minutes)
- Maximum Pageviews: 155 pages
- Maximum Session Quality Dimension: 97
timeOnSite are only counted once per session. We'll explore the uniqueness of visitor and session data in a later lab.
- Looking at the histogram for
sessionQualityDim, are the data values evenly distributed?
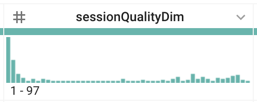
Answer: No, they are skewed to lower values (low quality sessions), which is expected.
- What is the date range for the dataset? Hint: Look at date field
Answer: 8/1/2017 (one day of data)
- You might see a red bar under the
productSKUcolumn. If so, what might that mean?
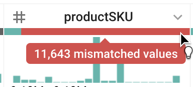
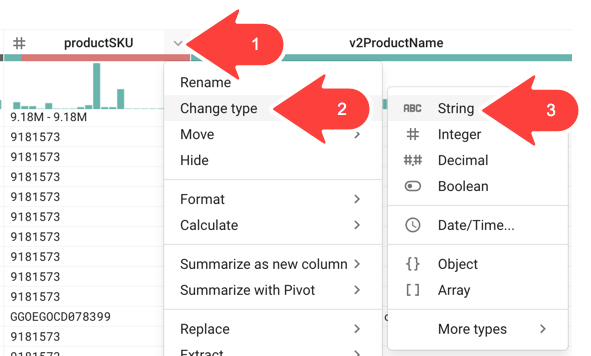
Answer: A red bar indicates mismatched values. While sampling data, Cloud Dataprep attempts to automatically identify the type of each column. If you do not see a red bar for the productSKU column, then this means that Cloud Dataprep correctly identified the type for the column (i.e. the String type). If you do see a red bar, then this means that Cloud Dataprep found enough number values in its sampling to determine (incorrectly) that the type should be Integer. Cloud Dataprep also detected some non-integer values and therefore flagged those values as mismatched. In fact, the productSKU is not always an integer (for example, a correct value might be "GGOEGOCD078399"). So in this case, Cloud Dataprep incorrectly identified the column type: it should be a string, not an integer. You will fix that later in this lab.
- Looking at the
v2ProductNamecolumn, what are the most popular products?
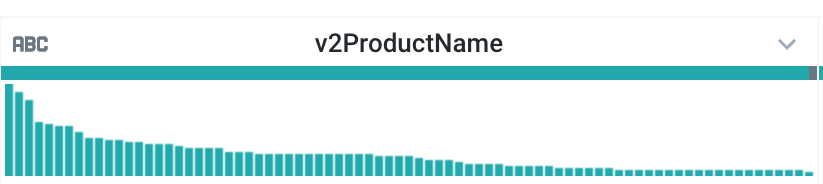
Answer: Nest products
- Looking at the
v2ProductCategorycolumn, what are some of the most popular product categories?
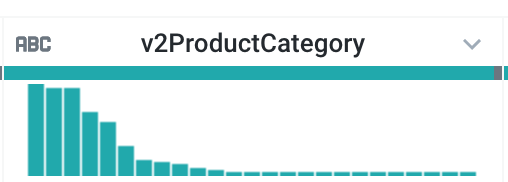
Answers:
The most popular product categories are:
-
Nest
-
Bags
-
(not set) (which means that some sessions are not associated with a category)
-
True or False? The most common
productVariantisCOLOR.
Answer: False. It's (not set) because most products do not have variants (80%+)
- What are the two values in the type column?
Answer: PAGE and EVENT
A user can have many different interaction types when browsing your website. Types include recording session data when viewing a PAGE or a special EVENT (like "clicking on a product") and other types. Multiple hit types can be triggered at the exact same time so you will often filter on type to avoid double counting. We'll explore this more in a later analytics lab.
- What is the maximum
productQuantity?
Answer: 100 (your answer may vary)
productQuantity indicates how many units of that product were added to cart. 100 means 100 units of a single product was added.
- What is the dominant
currencyCodefor transactions?
Answer: USD (United States Dollar)
- Are there valid values for
itemQuantityoritemRevenue?
Answer: No, they are all NULL (or missing) values.
- What percentage of
transactionIdvalues are valid? What does this represent for ourecommercedataset?
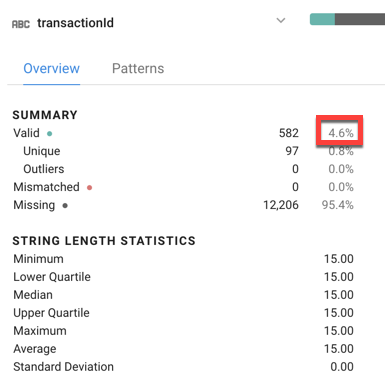
- Answer: About 4.6% of transaction IDs have a valid value, which represents the average conversion rate of the website (4.6% of visitors transact).
- How many
eCommerceAction_typevalues are there, and what is the most common value?
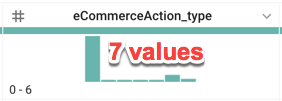
Answers: There are seven values found in our sample. The most common value is zero 0 which indicates that the type is unknown. This makes sense as the majority of the web sessions on our website will not perform any ecommerce actions as they are just browsing.
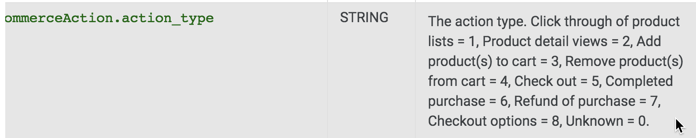
- Using the schema, what does
eCommerceAction_type = 6represent?
eCommerceAction type and read the description for the mapping
Answer: 6 maps to "Completed purchase". Later in this lab we will ingest this mapping as part of our data pipeline.
Task 5. Cleaning the data
In this task, you will clean the data by deleting unused columns, eliminating duplicates, creating calculated fields, and filtering out unwanted rows.
Converting the productSKU column data type
- To ensure that the productSKU column type is a string data type, open the menu to the right of the productSKU column by clicking
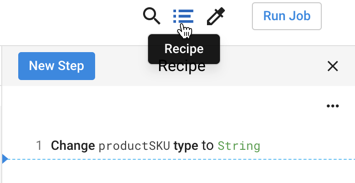
- Verify that the first step in your data transformation pipeline was created by clicking on the Recipe icon:
Deleting unused columns
As we mentioned earlier, we will be deleting the itemQuantity and itemRevenue columns as they only contain NULL values and are not useful for the purpose of this lab.
- Open the menu for the itemQuantity column, and then click Delete.
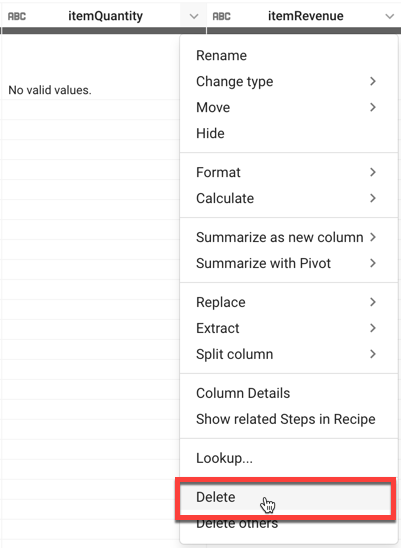
- Repeat the process to delete the itemRevenue column.
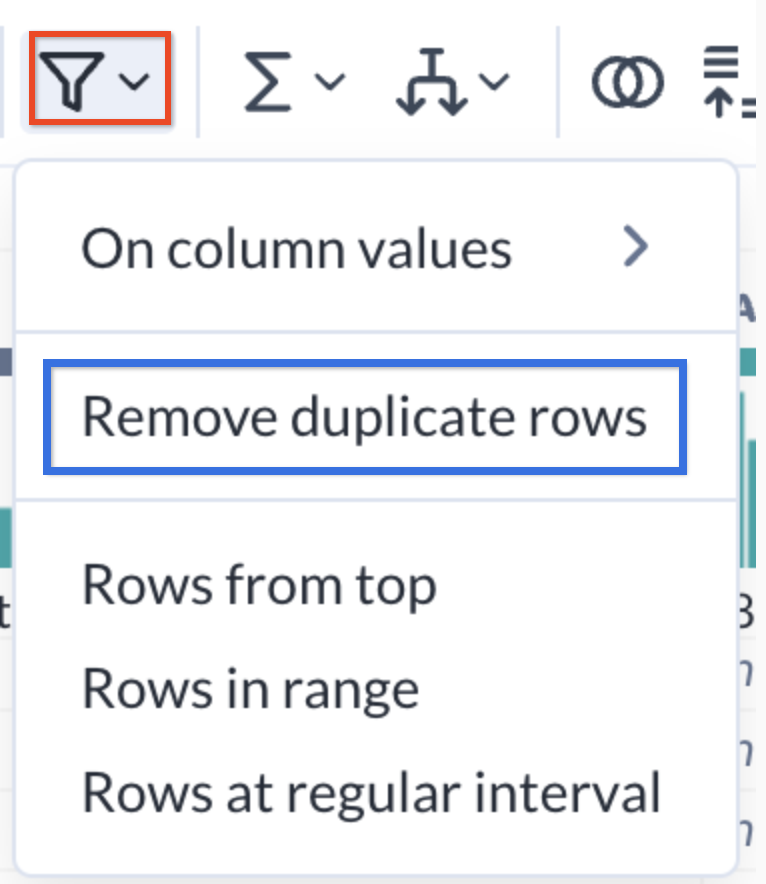
Deduplicating rows
Your team has informed you there may be duplicate session values included in the source dataset. Let's remove these with a new deduplicate step.
- Click the Filter rows icon in the toolbar, then click Remove duplicate rows.
-
Click Add in the right-hand panel.
-
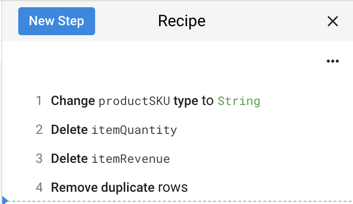
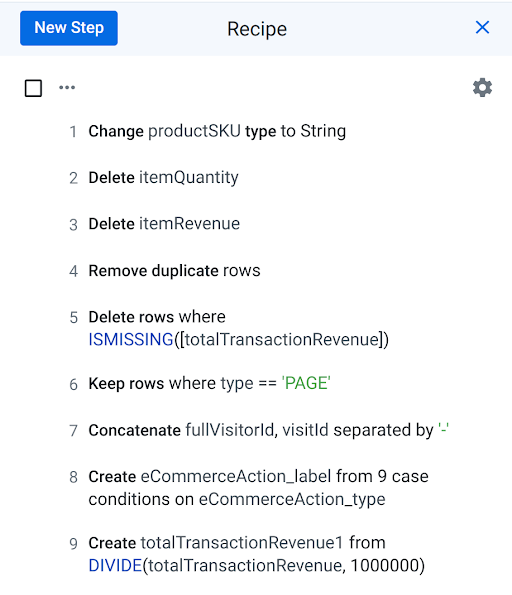
Review the recipe that you created so far, it should resemble the following:
Filtering out sessions without revenue
Your team has asked you to create a table of all user sessions that bought at least one item from the website. Filter out user sessions with NULL revenue.
- Under the totalTransactionRevenue column, click the grey Missing values bar. All rows with a missing value for totalTransactionRevenue are now highlighted in red.
- In the Suggestions panel, in Delete rows , click Add.
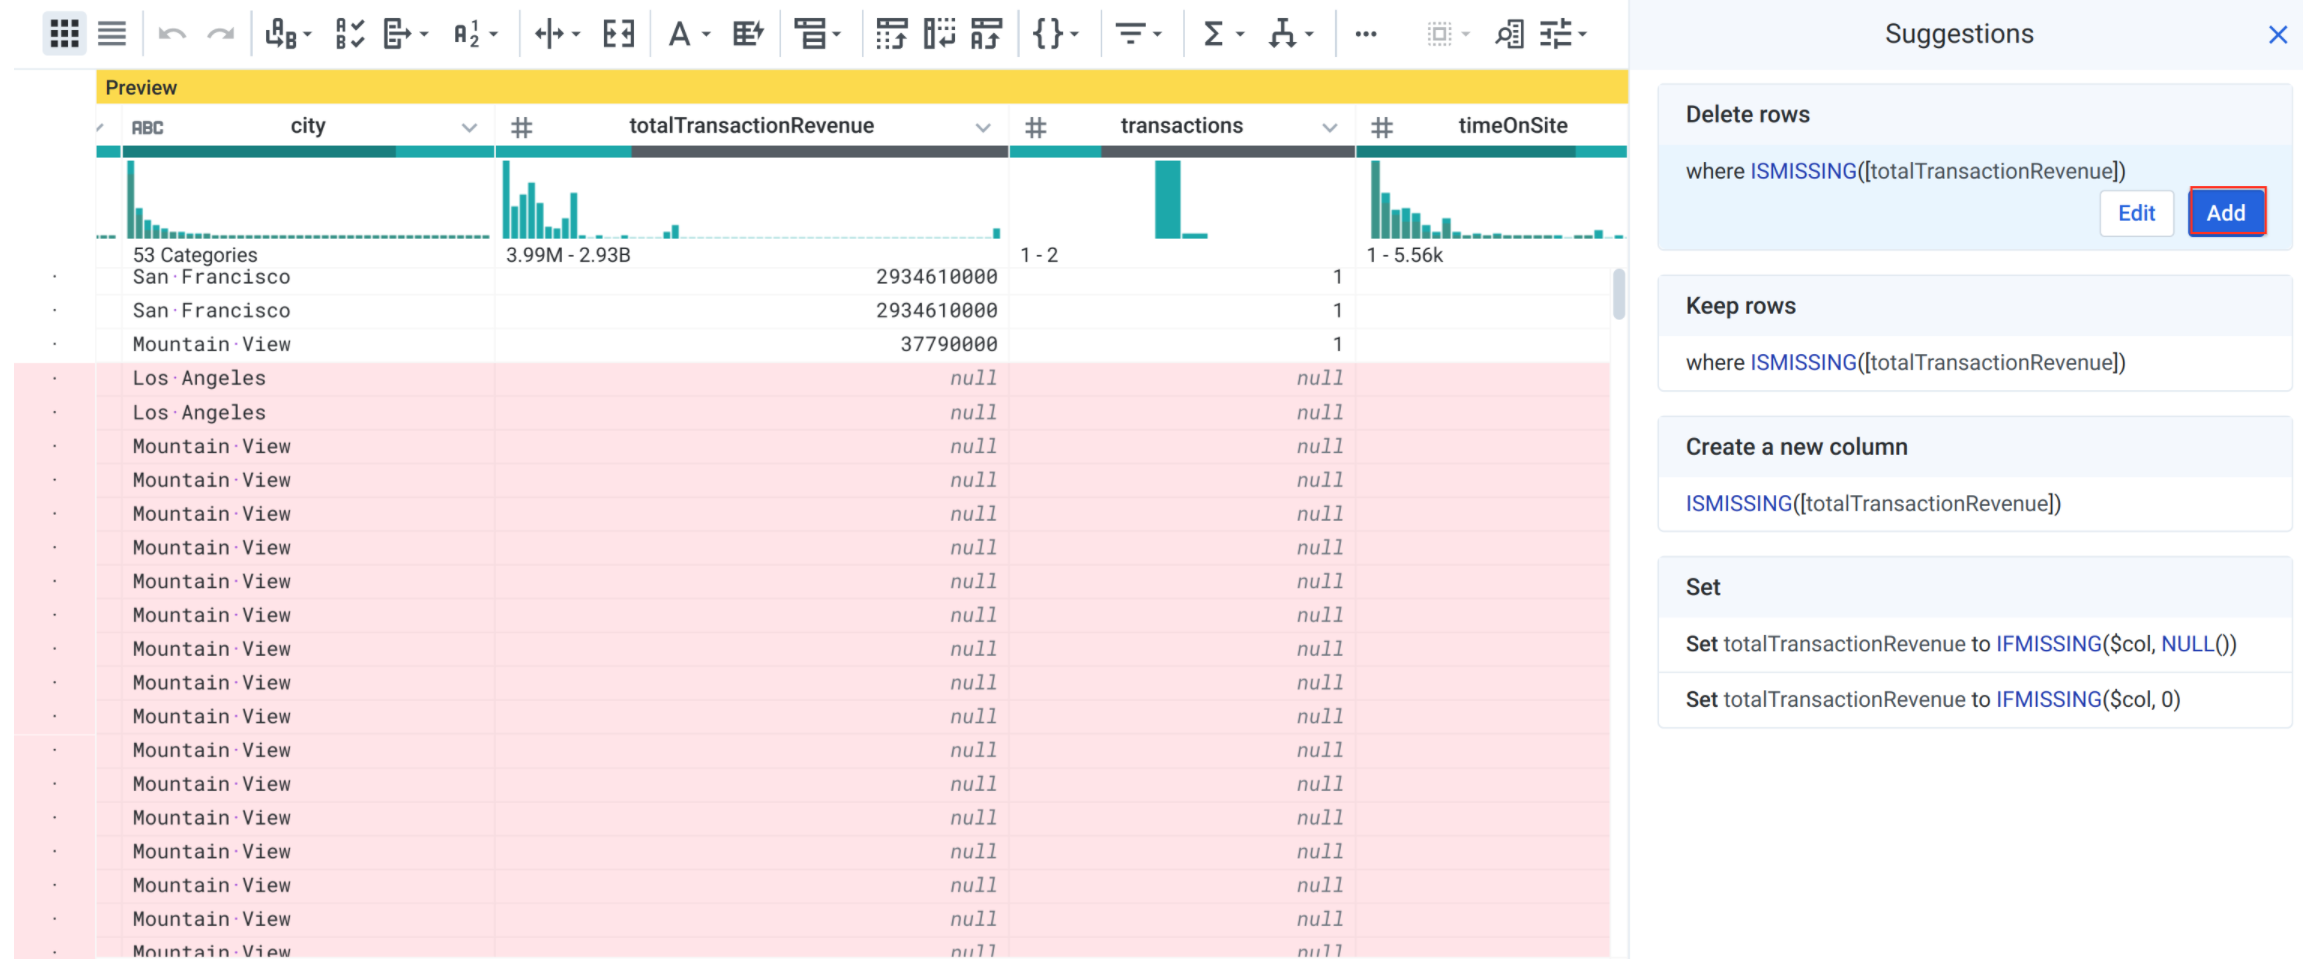
This step filters your dataset to only include transactions with revenue (where totalTransactionRevenue is not NULL).
Filtering sessions for PAGE views
The dataset contains sessions of different types, for example PAGE (for page views) or EVENT (for triggered events like "viewed product categories" or "added to cart"). To avoid double counting session pageviews, add a filter to only include page view related hits.
-
In the histogram below the type column, click the bar for PAGE. All rows with the type PAGE are now highlighted in green.
-
In the Suggestions panel, in Keep rows, and click Add.
Task 6. Enriching the data
Search your schema documentation for visitId and read the description to determine if it is unique across all user sessions or just the user.
-
visitId: an identifier for this session. This is part of the value usually stored as theutmbcookie. This is only unique to the user. For a completely unique ID, you should use a combination of fullVisitorId and visitId.
As we see, visitId is not unique across all users. We will need to create a unique identifier.
Creating a new column for a unique session ID
As you discovered, the dataset has no single column for a unique visitor session. Create a unique ID for each session by concatenating the fullVisitorId and visitId fields.
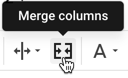
- Click on the Merge columns icon in the toolbar.
-
For Columns, select
fullVisitorIdandvisitId. -
For Separator type a single hyphen character:
-. -
For the New column name, type
unique_session_id.
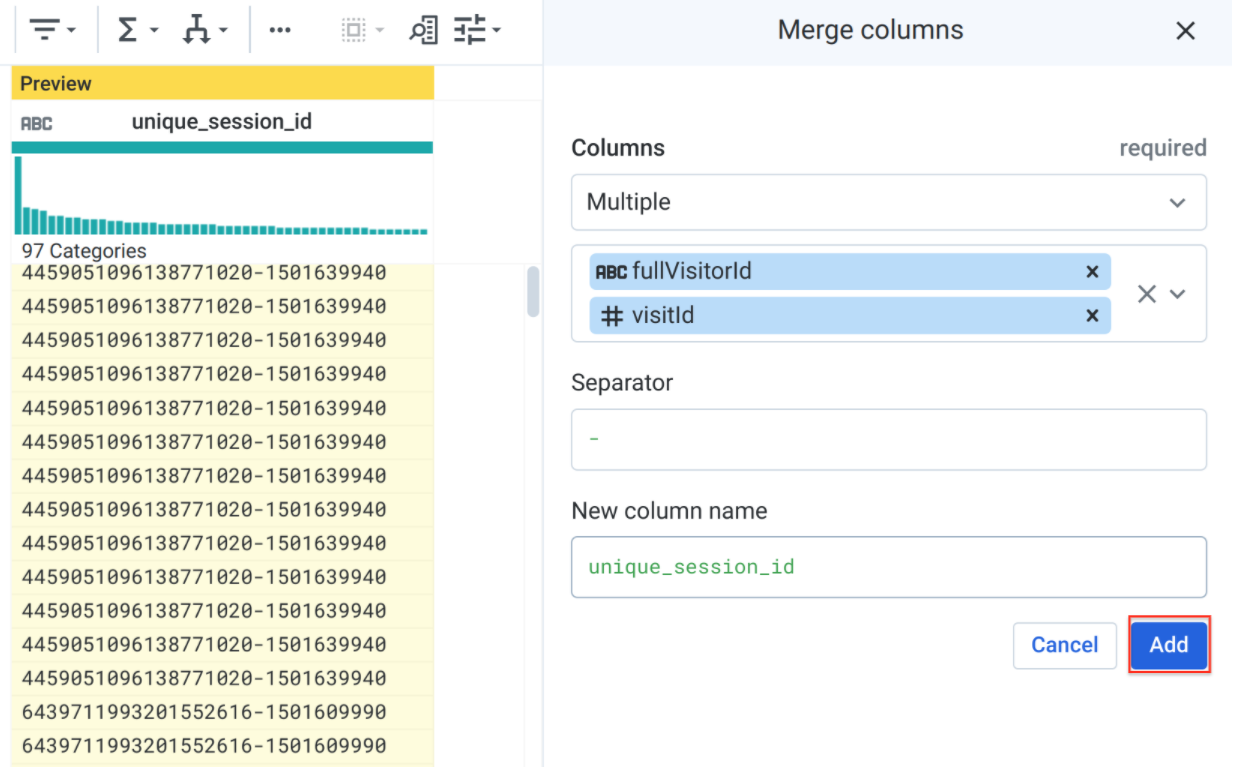
- Click Add.
The unique_session_id is now a combination of the fullVisitorId and visitId. We will explore in a later lab whether each row in this dataset is at the unique session level (one row per user session) or something even more granular.
Creating a case statement for the ecommerce action type
As you saw earlier, values in the eCommerceAction_type column are integers that map to actual ecommerce actions performed in that session. For example, 3 = "Add to Cart" or 5 = "Check out". This mapping will not be immediately apparent to our end users so let's create a calculated field that brings in the value name.
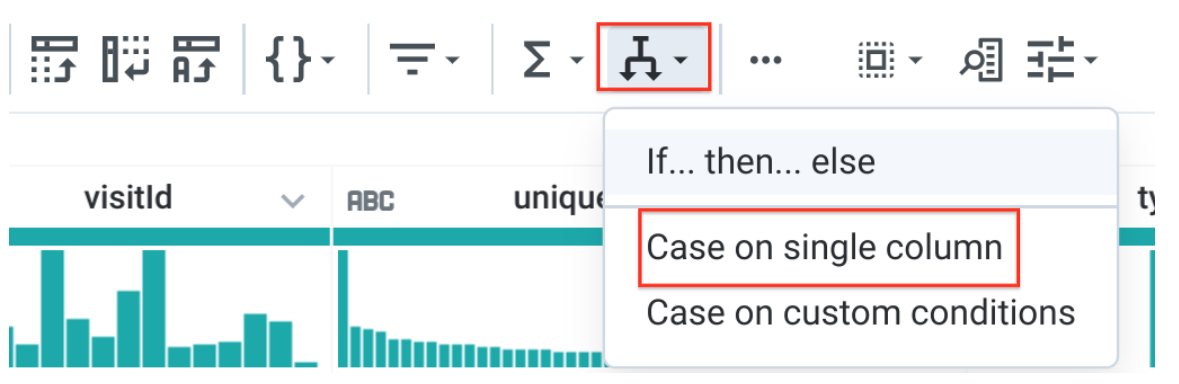
- Click on Conditions in the toolbar, then click Case on single column.
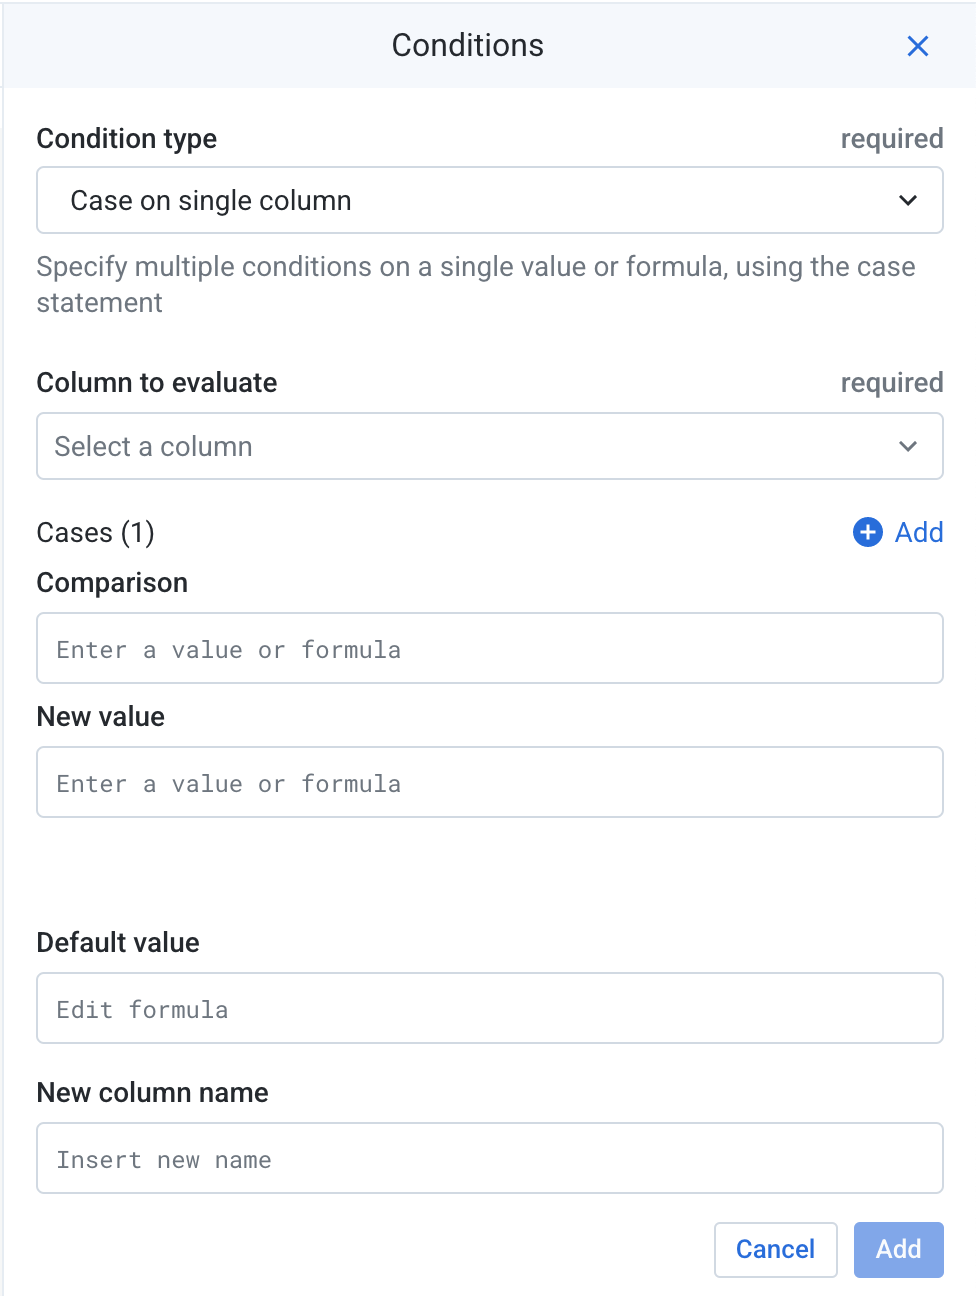
-
For Column to evaluate, specify
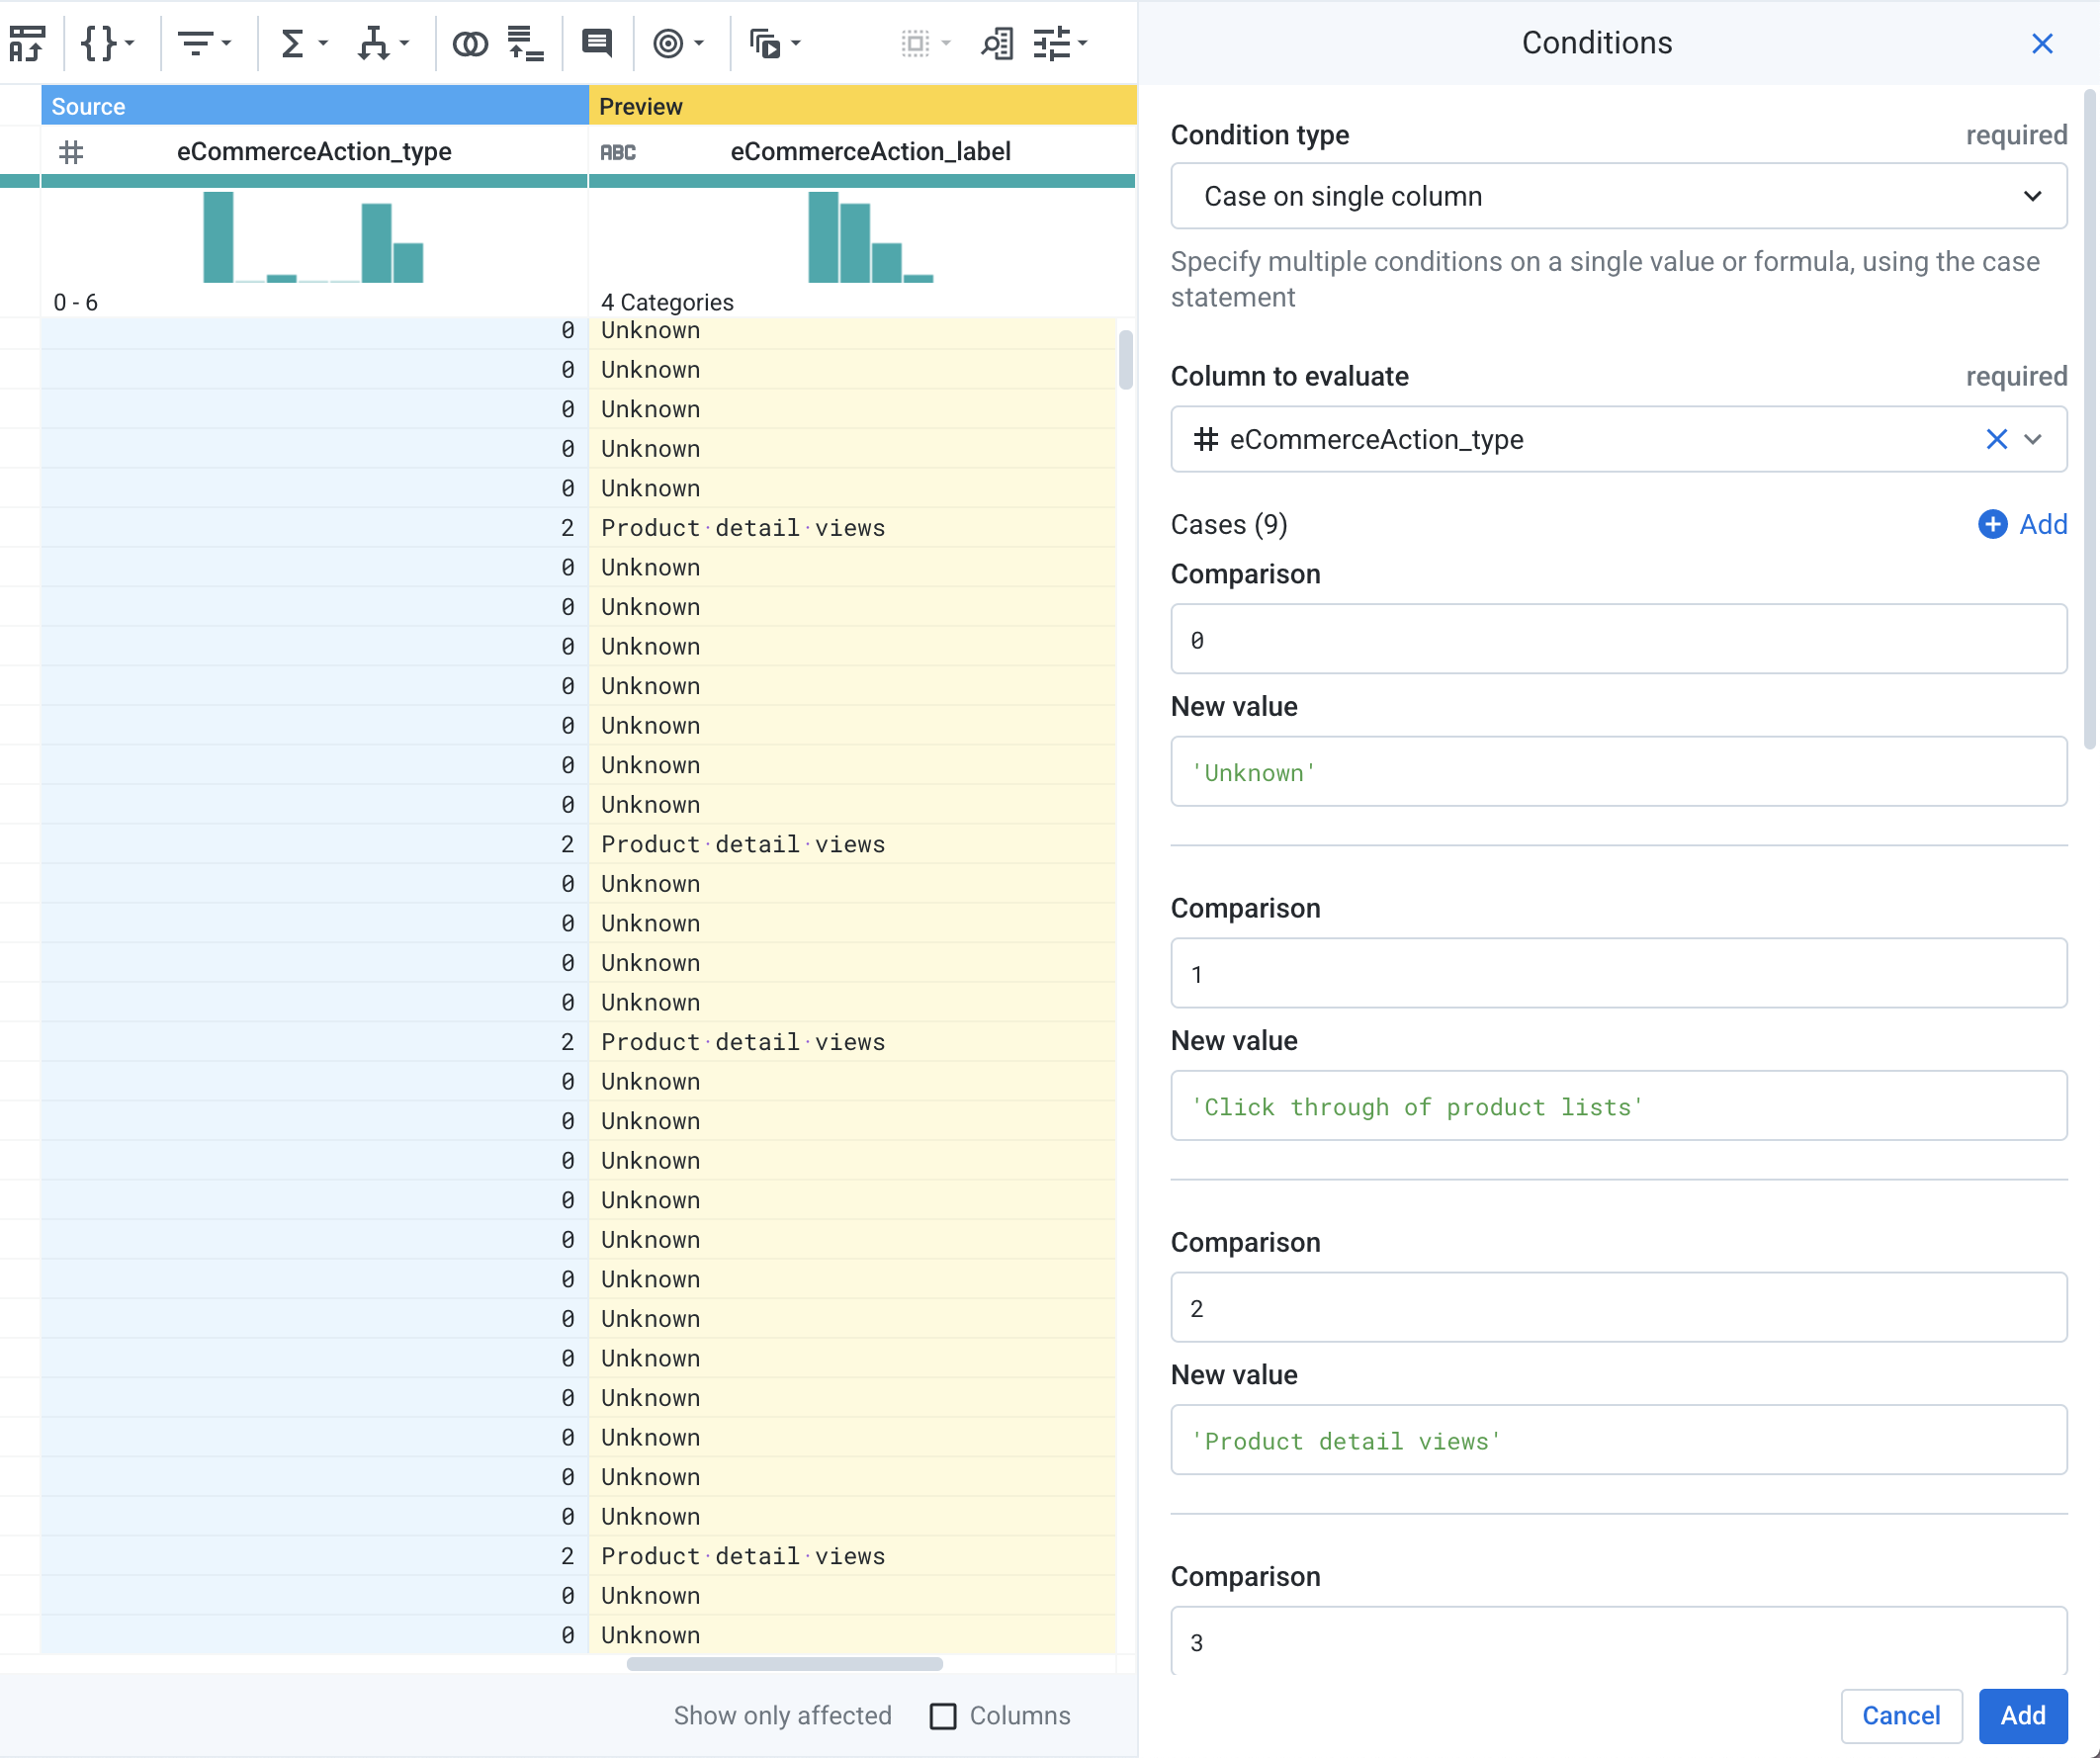
eCommerceAction_type. -
Next to Cases (1), click Add 8 times for a total of 9 cases.
- For each Case, specify the following mapping values (including the single quote characters):
|
Comparison |
New value |
|
|
|
|
|
|
|
|
|
|
|
|
|
|
|
|
|
|
|
|
|
|
|
|
|
|
|
-
For New column name, type
eCommerceAction_label. Leave the other fields at their default values. -
Click Add.
Adjusting values in the totalTransactionRevenue column
As mentioned in the schema, the totalTransactionRevenue column contains values passed to Analytics multiplied by 10^6 (e.g., 2.40 would be given as 2400000). You now divide the contents of that column by 10^6 to get the original values.
- Open the menu to the right of the totalTransactionRevenue column by clicking
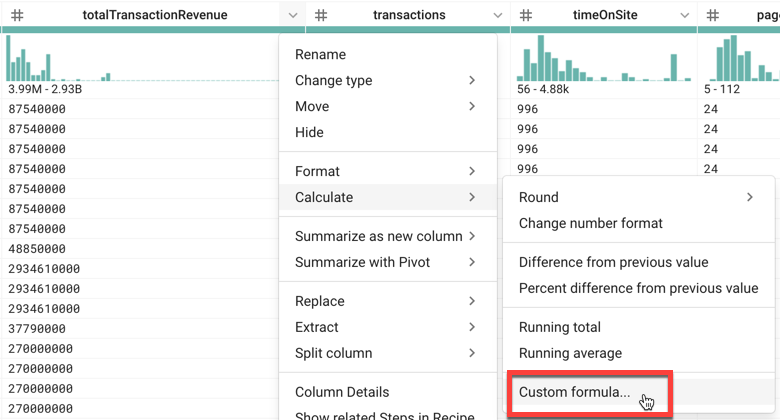
- For Formula, type:
DIVIDE(totalTransactionRevenue,1000000)and for New column name, type:totalTransactionRevenue1. Notice the preview for the transformation:
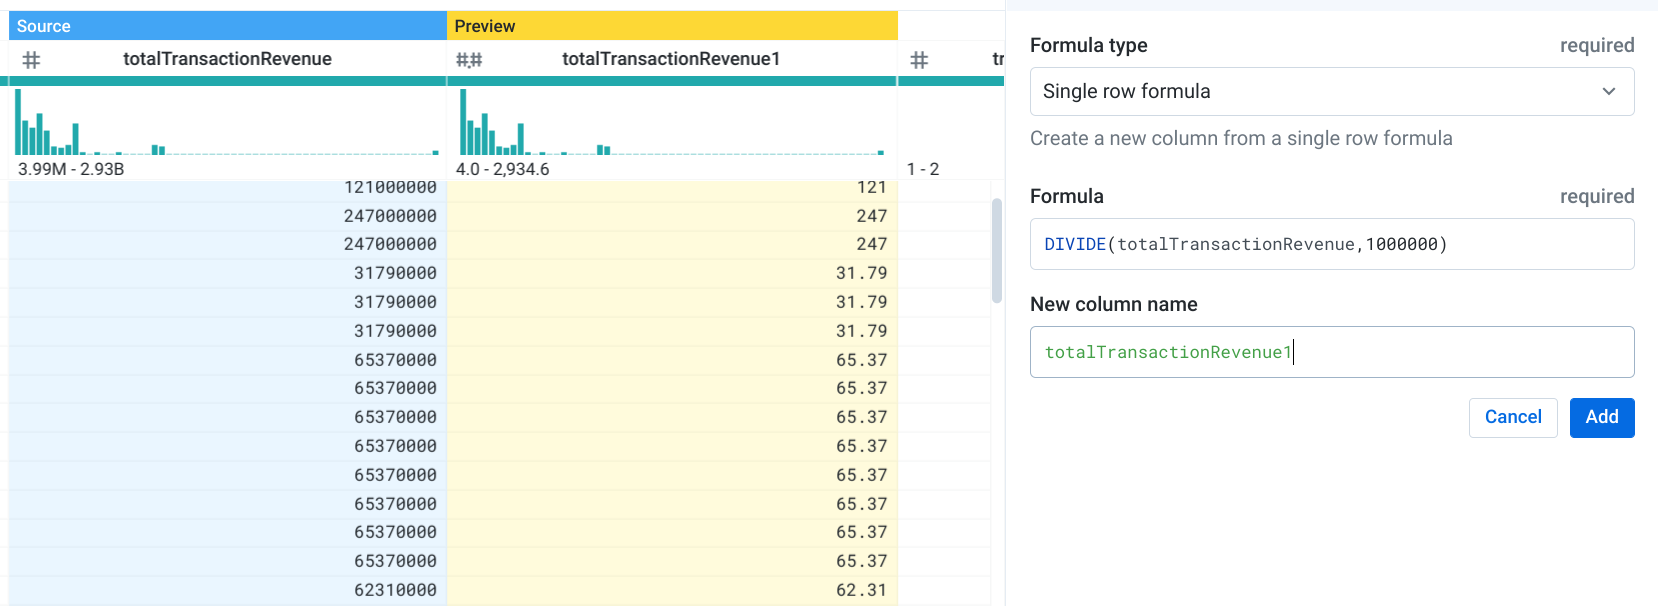
- Click Add.
totalTransactionRevenue1 column. Open the menu to the right of the totalTransactionRevenue1 column by clicking , then click Change type > Decimal.- Review the full list of steps in your recipe:
- You can now click Run.
Task 7. Running Cloud Dataprep jobs to BigQuery
-
In the Run Job page, select Dataflow + Bigquery for your Running Environment.
-
Under Publishing Actions, click on Edit on the right of Create-CSV.
-
In the following page, select BigQuery from the left hand menu.
-
Select your ecommerce dataset.
-
Click Create a New Table from the panel on the right.
-
Name your table revenue_reporting.
-
Select Drop the Table every run.
-
Click on Update.
-
Click RUN.
Once your Cloud Dataprep job is completed, refresh your BigQuery page and confirm that the output table revenue_reporting exists.
Click Check my progress to verify the objective.
Congratulations!
You've successfully explored your ecommerce dataset and created a data transformation pipeline with Cloud Dataprep.
Next steps / Learn more
- Check out Alteryx on the Google Cloud Marketplace.
- Have a Google Analytics account and want to query your own datasets in BigQuery? Follow this export guide.
- Check out these labs:
Google Cloud training and certification
...helps you make the most of Google Cloud technologies. Our classes include technical skills and best practices to help you get up to speed quickly and continue your learning journey. We offer fundamental to advanced level training, with on-demand, live, and virtual options to suit your busy schedule. Certifications help you validate and prove your skill and expertise in Google Cloud technologies.
Manual Last Updated February 11, 2024
Lab Last Tested September 20, 2023
Copyright 2024 Google LLC All rights reserved. Google and the Google logo are trademarks of Google LLC. All other company and product names may be trademarks of the respective companies with which they are associated.