Checkpoint
Create Project 2's virtual machine
/ 5
Create a Cloud Monitoring Group
/ 5
Uptime Check for your group
/ 5
Alerting Policy for the group
/ 5
Monitoring Multiple Projects with Cloud Monitoring
- GSP090
- Overview
- Objectives
- Setup and requirements
- Setup for two projects
- Task 1. Create Project 2's virtual machine
- Task 2. Monitoring Overview
- Task 3. Uptime check for your group
- Task 4. Alerting policy for the group
- Task 5. Custom dashboard for your group
- Task 6. Remove one instance to cause a problem
- (Optional) Remove your alerting policy
- Task 7. Test your understanding
- Congratulations!
GSP090

Overview
Cloud Monitoring provides dashboards and alerts so you can review performance metrics for cloud services, virtual machines, and common open source servers such as MongoDB, Apache, Nginx, Elasticsearch, and more. You configure Cloud Monitoring in the Console.
In this hands-on lab you will have 2 projects to monitor in Cloud Monitoring. You'll add them both to a Cloud Monitoring account and monitor the metrics the virtual machines in the projects provide.
Objectives
In this lab, you will learn how to:
- Create a Cloud Monitoring account that has two Google Cloud projects.
- Monitor across both projects from the single Cloud Monitoring account.
Setup and requirements
Before you click the Start Lab button
Read these instructions. Labs are timed and you cannot pause them. The timer, which starts when you click Start Lab, shows how long Google Cloud resources will be made available to you.
This hands-on lab lets you do the lab activities yourself in a real cloud environment, not in a simulation or demo environment. It does so by giving you new, temporary credentials that you use to sign in and access Google Cloud for the duration of the lab.
To complete this lab, you need:
- Access to a standard internet browser (Chrome browser recommended).
- Time to complete the lab---remember, once you start, you cannot pause a lab.
How to start your lab and sign in to the Google Cloud console
-
Click the Start Lab button. If you need to pay for the lab, a pop-up opens for you to select your payment method. On the left is the Lab Details panel with the following:
- The Open Google Cloud console button
- Time remaining
- The temporary credentials that you must use for this lab
- Other information, if needed, to step through this lab
-
Click Open Google Cloud console (or right-click and select Open Link in Incognito Window if you are running the Chrome browser).
The lab spins up resources, and then opens another tab that shows the Sign in page.
Tip: Arrange the tabs in separate windows, side-by-side.
Note: If you see the Choose an account dialog, click Use Another Account. -
If necessary, copy the Username below and paste it into the Sign in dialog.
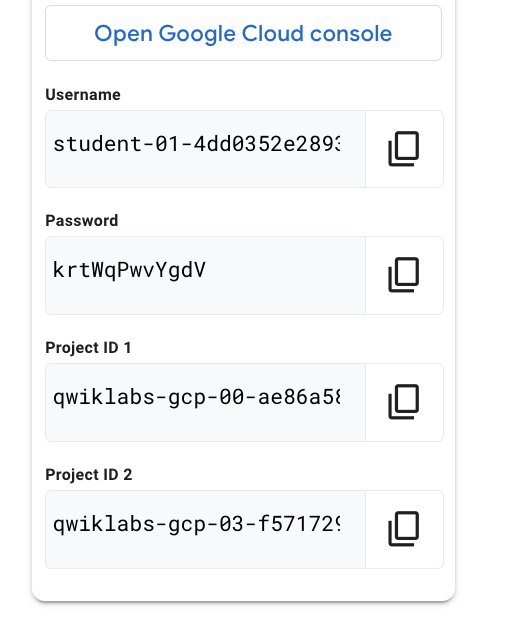
{{{user_0.username | "Username"}}} You can also find the Username in the Lab Details panel.
-
Click Next.
-
Copy the Password below and paste it into the Welcome dialog.
{{{user_0.password | "Password"}}} You can also find the Password in the Lab Details panel.
-
Click Next.
Important: You must use the credentials the lab provides you. Do not use your Google Cloud account credentials. Note: Using your own Google Cloud account for this lab may incur extra charges. -
Click through the subsequent pages:
- Accept the terms and conditions.
- Do not add recovery options or two-factor authentication (because this is a temporary account).
- Do not sign up for free trials.
After a few moments, the Google Cloud console opens in this tab.

Setup for two projects
For this lab you are given two Project IDs. When you logged in, by default you logged in to Project 1. You'll need to keep track of your projects, and you can return to this page to remind yourself which is which. The projects will change order, so knowing the last few digits of the name will help you identify them.
Project 1 already has a virtual machine (and you can look at it by going to Compute Engine > VM instances). You will create a virtual machine in Project 2, and then monitor both projects in Cloud Monitoring.
Task 1. Create Project 2's virtual machine
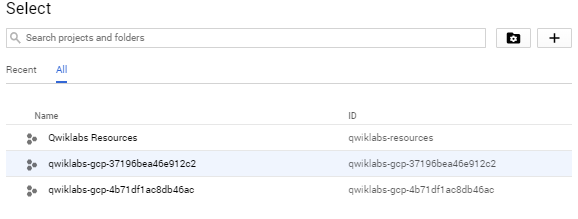
- At the top of the screen, click on the dropdown arrow next to Project 1's name.

-
Make sure that you're on the All tab, then click on the name of Project 2 to go into it.
-
Select Navigation menu > Compute Engine to open the VM instances window.
-
Click +Create instance to create a new instance.
-
Name this instance instance2.
-
Select
Regionand Zone.
Leave all of the options at the default settings.
- Click Create.
Now you have resources to monitor in both of your projects.
Test completed task
Click Check my progress to verify your performed task. If you have completed the task successfully you will be granted an assessment score.
Create a Monitoring Metrics Scope
Set up a Monitoring Metrics Scope that's tied to your Google Cloud Project. The following steps create a new account that has a free trial of Monitoring.
- In the Cloud Console, click Navigation menu (
) > Monitoring.
When the Monitoring Overview page opens, your metrics scope project is ready.
Now add both projects to Monitoring.
-
In the left panel, click Monitoring Settings and then in the Settings window, click +Add GCP PROJECTS in the GCP Projects section.
-
Click Select Projects.
-
Check Project ID 1 and click Select.
-
Click Add projects.
Task 2. Monitoring Overview
Click on Overview in the left menu. You'll be adding a lot of good information here as the lab goes along. First, you'll create a Cloud Monitoring Group for visibility across both projects.
About Cloud Monitoring groups
Cloud Monitoring lets you define and monitor groups of resources, such as VM instances, databases, and load balancers. Groups can be based on names, tags, regions, applications, and other criteria. You can also create subgroups, up to six levels deep, within groups.
Create a Cloud Monitoring group
-
In the left menu, click Groups, then click +Create group.
-
Name your group DemoGroup.
The Criteria is a set of rules that will dynamically evaluate which resources should be part of this group.
Cloud Monitoring dynamically determines which resources belong to your group based on the filter criteria that you set up.
- In the first dropdown field (Type), Name is selected by default.
- In the second dropdown (Operator), Contains is selected by default.
- In the third field (Value), type in "instance" since both of the instance names in both of your projects start with the word
instance.
- Click Done, then click Create.
Test completed task
Click Check my progress to verify your performed task. If you have completed the task successfully you will be granted an assessment score.
Task 3. Uptime check for your group
Uptime checks let you quickly verify the health of any web page, instance, or group of resources. Each configured check is regularly contacted from a variety of locations around the world. Uptime checks can be used as conditions in alerting policy definitions.
-
In the left menu, click Uptime checks, then click +Create uptime check.
-
Create your uptime check with the following information:
Protocol: TCP
Resource Type: Instance
Applies To: Group, and then select DemoGroup.
Port: 22
Check frequency: 1 minute, then click Continue.
-
Click Continue again.
-
Leave the slider ON state for Create an alert option in Alert & notification section, then click Continue.
-
For Title: enter
DemoGroup uptime check. -
Click TEST to verify that your uptime check can connect to the resource.
-
When you see a green check mark everything can connect, click Create.
Test completed task
Click Check my progress to verify your performed task. If you have completed the task successfully you will be granted an assessment score.
Task 4. Alerting policy for the group
Use Cloud Monitoring to create one or more alerting policies.
-
In the left menu, click Uptime checks.
-
Click the three dots
at the far right of your Display Name and click Add alert policy.
-
Click +Add alert condition.
-
Select the previously created Uptime health check on DemoGroup condition from the left section and click Delete alert condition.
-
In your New condition, click Select a metric.
-
Uncheck the Active.
-
In the Select a metric field, search
check_passedand click VM Instance > Uptime_check > Check passed. Click Apply. -
Click Add a filter, set the
Filterto check_id and select demogroup-uptime-check-id as theValue. Click Done.
demogroup-uptime-check-id check_id is unavailable, please wait for a few seconds and try.-
In left panel, click on the arrow button next to VM Instance-Check passed, then click on Configure trigger.
-
Select Metric absence as Condition type and click Next.
-
Turn off Configure notifications.
-
In the Alert policy name field, enter the Name as Uptime Check Policy. Click Next.
-
Click Create policy.
Test completed task
Click Check my progress to verify your performed task. If you have completed the task successfully you will be granted an assessment score.
Task 5. Custom dashboard for your group
Create a custom dashboard so you can monitor your group easily.
-
In the left menu, click Dashboards, then click +Create dashboard.
-
Name your dashboard.
-
Click +Add Widget and select Line option in Visualization.
-
In the Metric field, Uncheck the Active.
-
Search uptime (compute.googleapis.com/instance/uptime) and click VM Instance > Instance > Uptime. Click Apply.
The dashboard should look like:
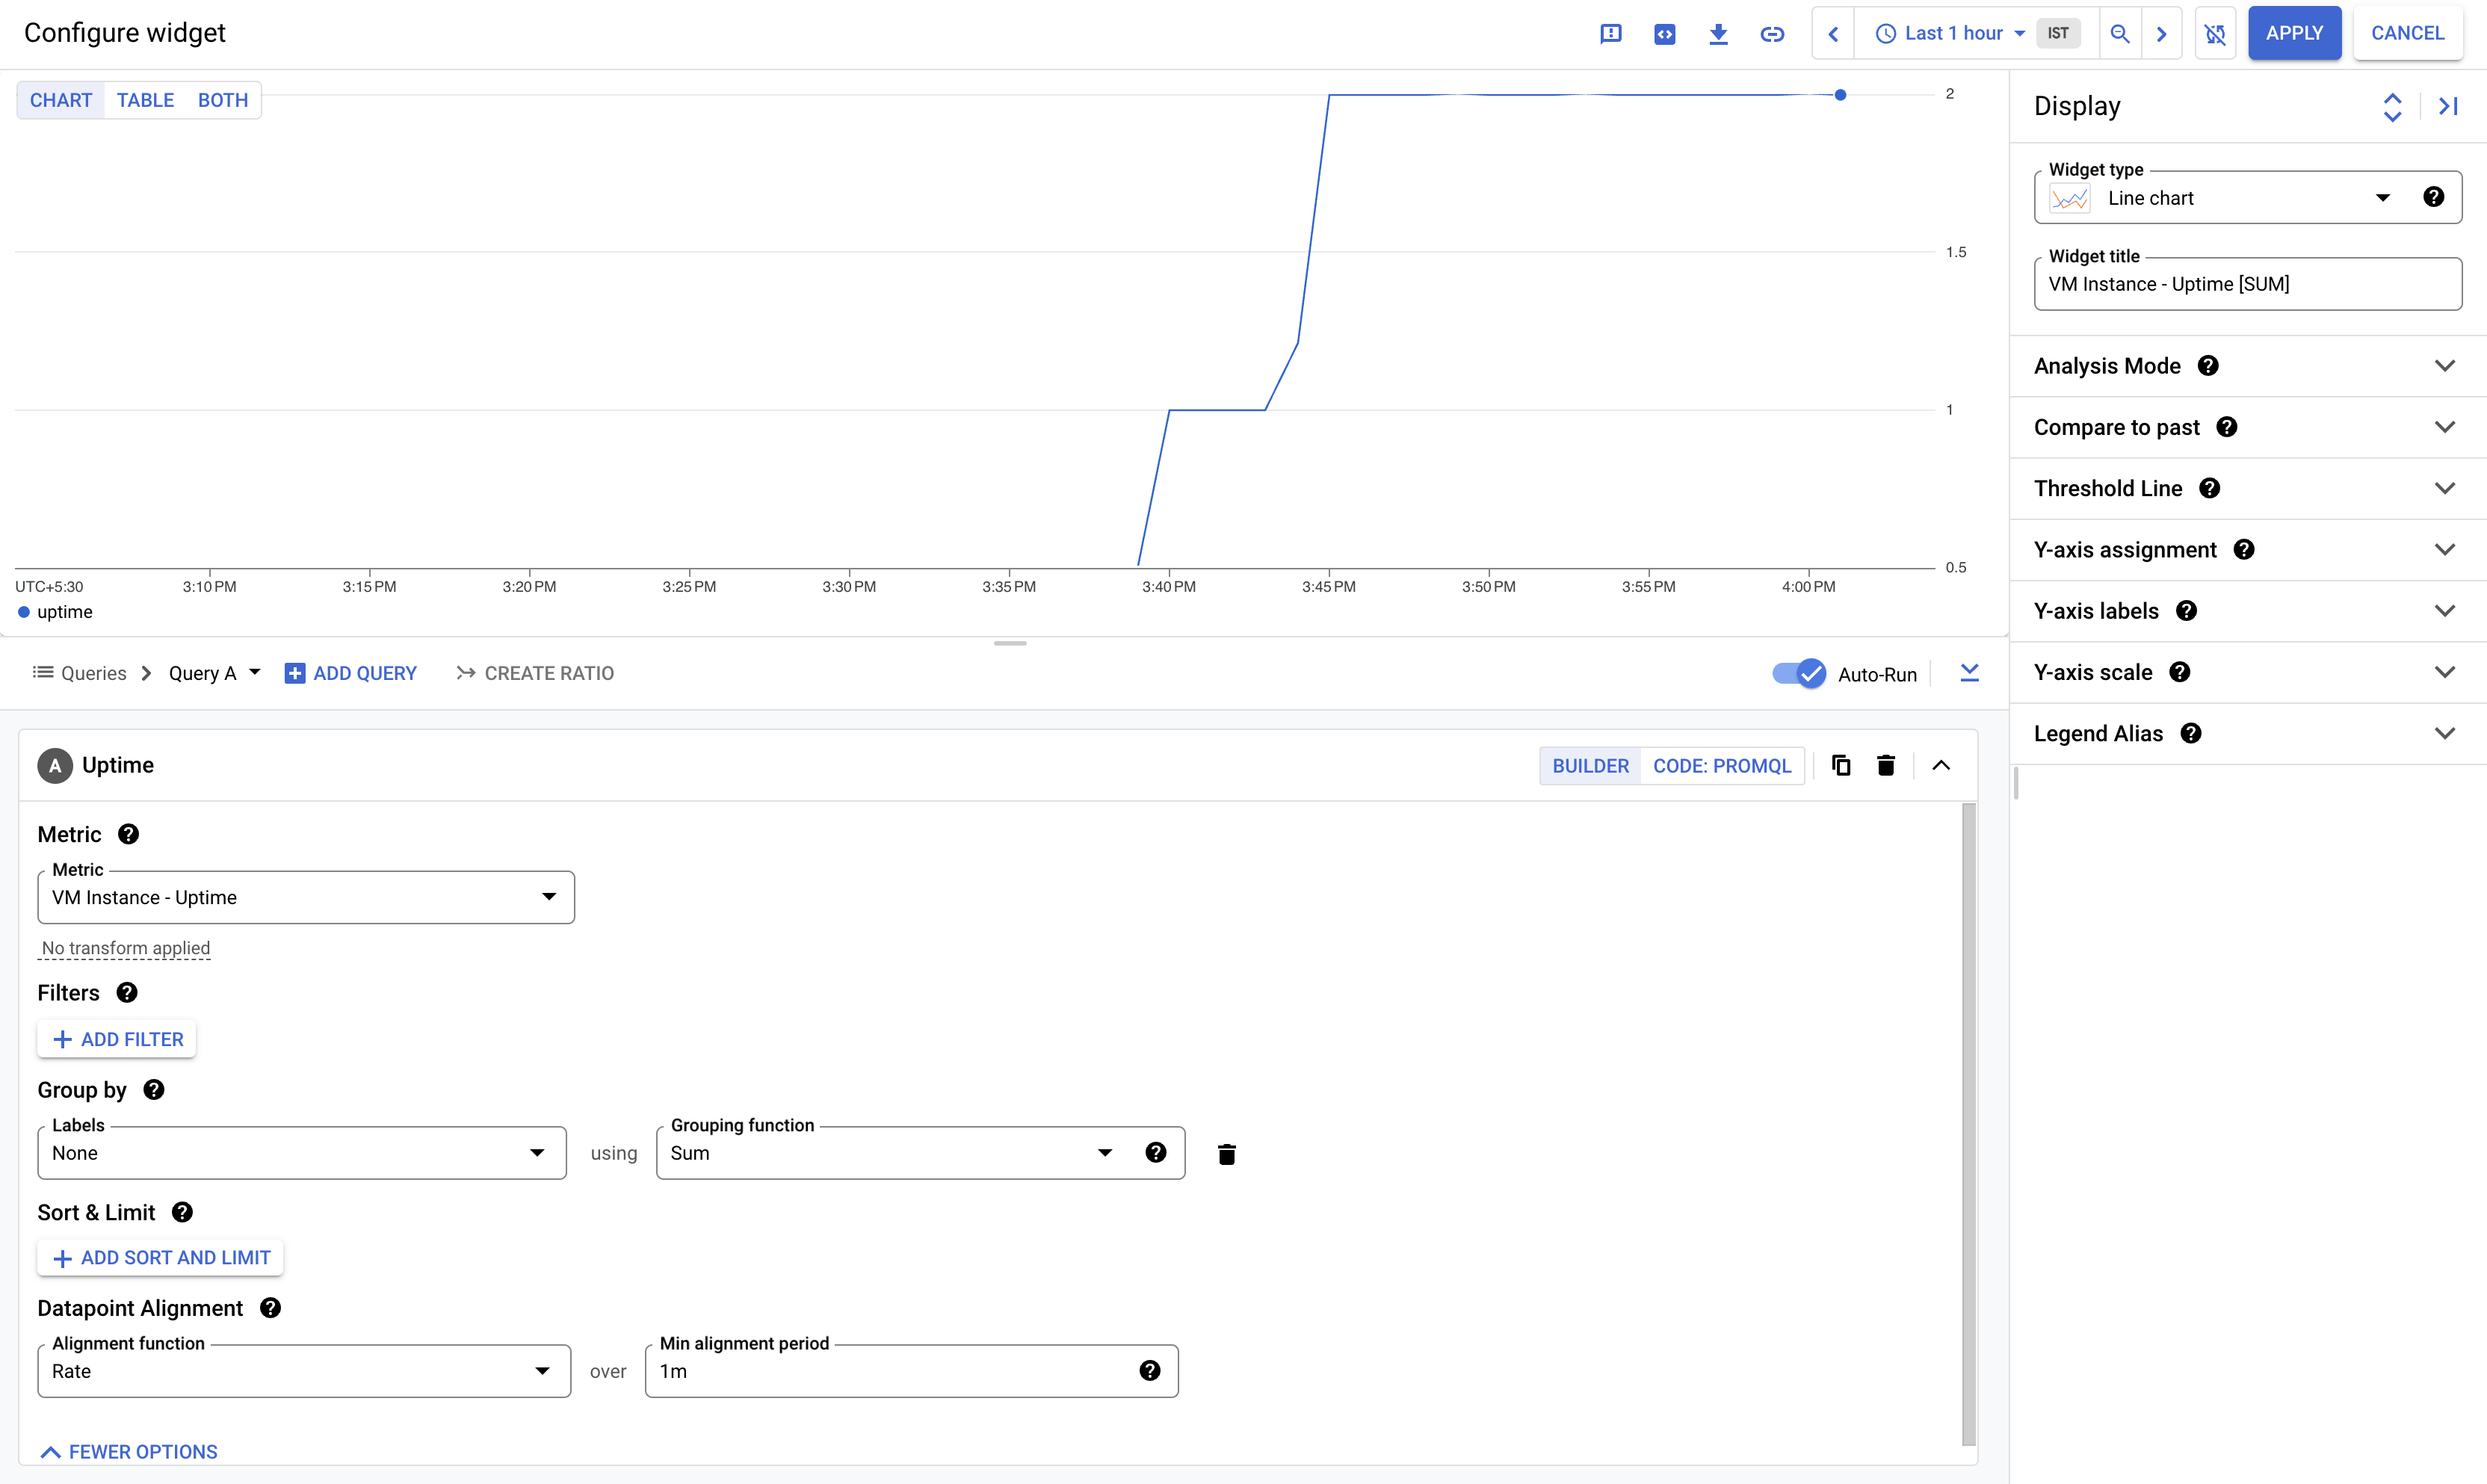
- Again click on Apply.
Task 6. Remove one instance to cause a problem
-
In the console, select Navigation menu > Compute Engine.
-
Check the box next to instance2, then click on the 3 vertical dots
-
Wait a minute or 2 for the instance to stop and violate the uptime check you just set up. After a couple of minutes, turn your machine back on by clicking Start/Resume, then Start.
-
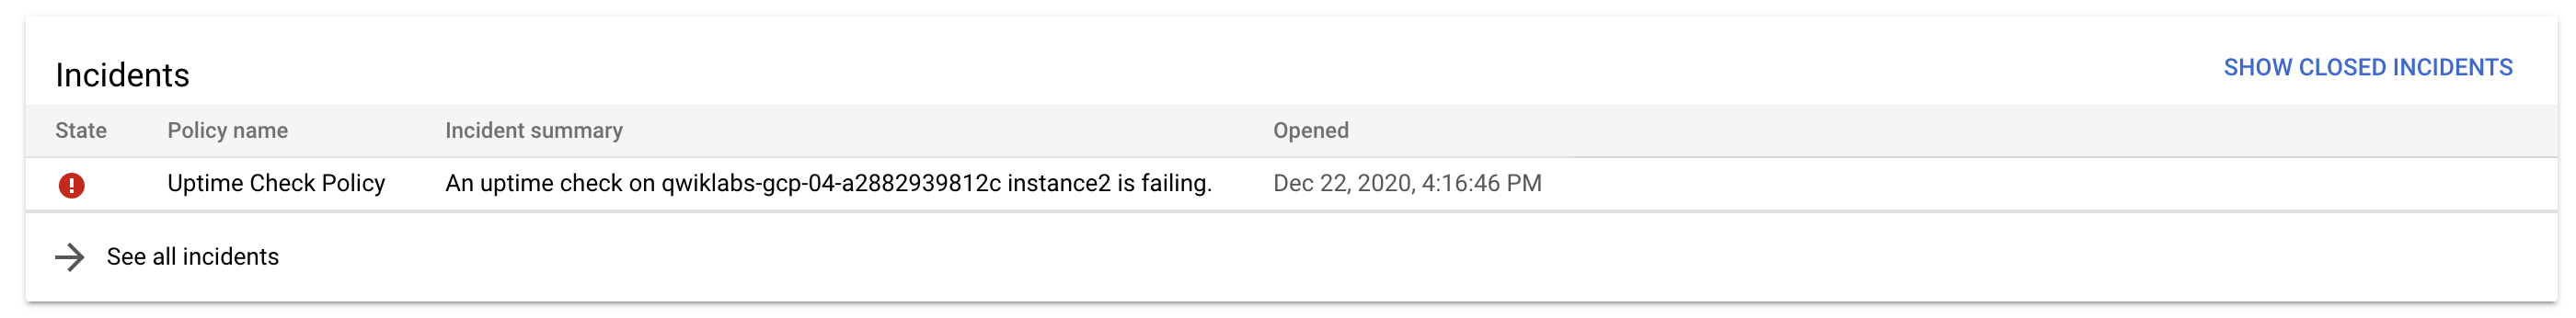
Click Navigation menu > Monitoring > Alerting and refresh your browser. It may take a few more minutes to show that you have issues in the Summary section. Refresh until you see an Incident similar to this:
Optional: Using the left menu, look at Dashboards to view your custom dashboard. This provides details on both VMs. If you mouse over your chart, you can see which of your instances was stopped and restarted.
Incidents
When the alerting policy conditions are violated, an "incident" is created and displayed in the Incident section.
Responders can acknowledge receipt of the notification and can close the incident when it has been taken care of.
- In the Incidents section, click on the name of the alerting policy that was violated to go into it.
You've already fixed your problem by turning the VM back on, so the incident was cleared and you no longer see an incident in the Incidents section.
- To see the cleared incident, scroll down and click on the Show closed incidents link.
Your incident should have a Closed status. You can read through the incident details.
- You can also click on the Uptime Check Policy link to explore the metrics it gives you.
In several more minutes the Monitoring Overview page will all go back to green when the instance in Project 2 passes the Uptime Check.
(Optional) Remove your alerting policy
If you set up an email alert as part of your alerting policy, there is a chance that you will receive a few emails about your resources even after the lab is completed.
To avoid this, remove the alerting policy before you complete your lab.
Task 7. Test your understanding
Below is a true/false question to reinforce your understanding of this lab's concepts. Answer it to the best of your ability.
Congratulations!
Congratulations! In this lab, you have monitored two Google Cloud projects in Cloud Monitoring, and responded to an incident with one of the instances in the Group. You also created a custom dashboard to monitor your group easily.
Google Cloud training and certification
...helps you make the most of Google Cloud technologies. Our classes include technical skills and best practices to help you get up to speed quickly and continue your learning journey. We offer fundamental to advanced level training, with on-demand, live, and virtual options to suit your busy schedule. Certifications help you validate and prove your skill and expertise in Google Cloud technologies.
Manual Last Updated March 19, 2024
Lab Last Tested March 19, 2024
Copyright 2024 Google LLC All rights reserved. Google and the Google logo are trademarks of Google LLC. All other company and product names may be trademarks of the respective companies with which they are associated.