Checkpoint
Pull all the billing data into your spreadsheet
/ 20
Refine your query
/ 10
Organize your spreadsheet
/ 20
Analyze your chart data
/ 20
Analyze your pivot table data
/ 20
Share with a link to the file
/ 10
Examining BigQuery Billing Data in Google Sheets
GSP623

Overview
As organizations grow in size and collect terabytes of complex data, they need tools to store and analyze their information. Each business unit may need to analyze a portion of that data for specific business needs. In Finance, for example, a financial controller may be interested in analyzing their Cloud Billing data to answer specific questions such as:
- What was the total cost of a project last month?
- Which project consumed the most networking resources?
- What is the monthly cost broken down by team?
BigQuery helps users manage and analyze large datasets with high-speed compute power. But not everyone is a BigQuery expert or a data specialist. Many people may be more comfortable using spreadsheets to perform ad hoc data analysis. You can use Google Workspace Connected Sheets to pull your BigQuery data into Google Sheets and perform your analysis.
What you'll learn
In this lab, you learn how to perform the following tasks:
- Use Google Workspace Connected Sheets to connect to BigQuery.
- Access data through BigQuery and import the data into Sheets.
- Explore ways to analyze the data in Sheets and to then share the output with other users.
Setup and requirements
Before you click the Start Lab button
Read these instructions. Labs are timed and you cannot pause them. The timer, which starts when you click Start Lab, shows how long Google Cloud resources will be made available to you.
This hands-on lab lets you do the lab activities yourself in a real cloud environment, not in a simulation or demo environment. It does so by giving you new, temporary credentials that you use to sign in and access Google Cloud for the duration of the lab.
To complete this lab, you need:
- Access to a standard internet browser (Chrome browser recommended).
- Time to complete the lab---remember, once you start, you cannot pause a lab.
Start your lab
- Click the Start Lab button. If you need to pay for the lab, a pop-up opens for you to select your payment method. On the left is a panel populated with the temporary credentials that you must use for this lab.
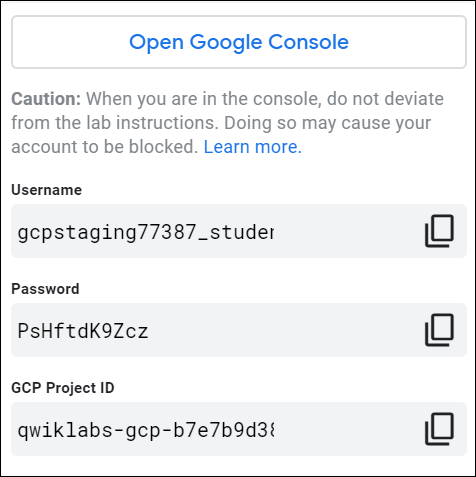
- Note the Username and Password, you may need them when you open Google Sheets.
Task 1. Open Sheets and connect to BigQuery
In this task, you use Google Workspace Connected Sheets to connect to BigQuery.
-
To open Google Sheets, click the following link:
-
If prompted, in the Welcome to Google Sheets dialog, click X.
-
To open a blank spreadsheet, in the Start a new spreadsheet pane, click Blank (
).
Connect to BigQuery
In this step you use Sheets to connect to BigQuery and access your billing data.
-
In the menu at the top, click Data > Data connectors > Connect to BigQuery.
-
In the Connect and analyze big data in Sheets dialog, click Get connected.
-
In the Add data connection dialog, select the project name that starts with qwiklabs-gcp-xxxxx.
You're now ready to use the Sheets data connector to pull information from BigQuery.
-
To open the BigQuery query editor, click Write custom query.
-
In the BigQuery query editor, review the right pane. The Schema section shows your project details, which you need to create a query. In this example:
- Project: [qwiklabs-gcp-xxx]
- Dataset: billing_dataset
- Table: enterprise_billing
- Columns: all values listed under enterprise_billing
Task 2. Write a query
In this task, you use Google Workspace Connected Sheets to query your billing data (from the enterprise_billing table), and then pull the query results into your spreadsheet.
For more information about writing queries in BigQuery, refer to Syntax for SQL queries in BigQuery.
Pull all the billing data into your spreadsheet
- In the BigQuery query editor, type the following:
-
SELECTspecifies columns. In this task, "*" (asterisk) selects all the columns. -
FROMspecifies where the data is pulled from, in the form [dataset].[table]; in this task, the data is pulled frombilling_dataset.enterprise_billing.A green check confirms that there are no errors in the script.
-
To view a sample of the returned data, click Preview results.
-
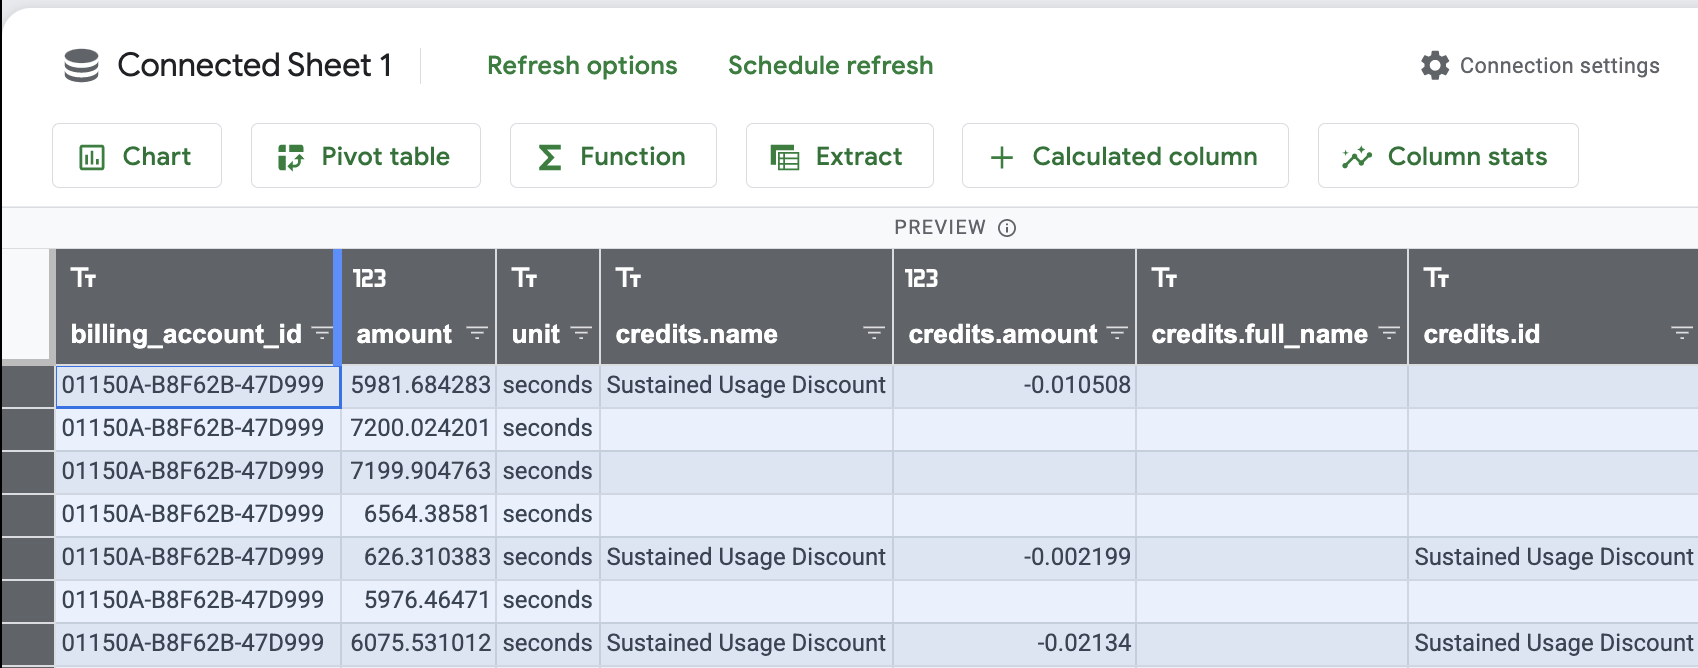
To pull the data into your Sheet, click Connect.
This creates the
Connected Sheet 1tab and pulls all the data into this tab. -
In the Success! Your data is connected dialog, click X.
You can use the Filter feature to organize and analyze the data. However, depending on what you want to analyze, it may be more efficient to pull over a subset of your data.
Test completed task
Click Check my progress to verify your performed task. If you have successfully run a query to pull all the billing data into your spreadsheet, you will receive an assessment score.
Refine your query
-
In the bottom left side, hover the refresh icon for Preview of full data set, > click More options (
), and then click Connection settings.
The BigQuery editor opens.
-
In the BigQuery query editor, clear the current query, and type the following:
This query uses:
-
SELECTto specify the columns -
WHEREto specify only data where theproject.nameisCTG - DevorCTG - Prodand the service isCompute Enginefor the month September 2020 to limit the number of rows in the sheet. -
ORDER BYto do exactly that: order the results byproject.name
-
When the green check is displayed, click Connect.
-
Examine your updated spreadsheet to see what changed.
Test completed task
Click Check my progress to verify your performed task. If you have successfully refined your query and inserted data into your spreadsheet, you will receive an assessment score.
Task 3. Organize and analyze your spreadsheet
In this task, you use some of the features of Sheets to organize and analyze your billing data.
Organize your spreadsheet
-
In Google Sheets, click Untitled spreadsheet, and then rename the sheet to My Billing Report.
-
Click File > Move (
), > My Drive and then click New Folder (
).
-
In the New Folder dialog, type Billing Reports, click Create Folder (
), and then click Move here.
-
To highlight all the rows and columns, click the upper left empty cell.
-
To resize the cell, click the right outside edge of the top cell of the first column, and then double-click.
The cell width changes to fit the text for each column.
Test completed task
Click Check my progress to verify your performed task.
Task 4. Analyze your data
In this task, you create tables and charts to analyze your data.
Calculated column
-
At the top, click Calculated column.
-
In the Add calculated column dialog, click Columns, and then select cost.
You may have to scroll down to see the cost option.
-
In the Enter name field, type Sum of Cost, and then click Add.
-
Click Apply.
Sum of Cost is added as a column to your spreadsheet.
Chart
-
At the top, click Chart, accept the defaults, and then click Create.
-
In Chart editor, in the Setup pane, do the following:
a. Click Add X-axis, and then select description.
b. Click Add Series, and then select Sum of Cost.
-
Click Apply.
A simple column chart is displayed.
-
To resize the chart, click the chart and drag out the corners.
-
In the chart, hover over the different areas to see the pop-up descriptions.
-
Click the chart, click more (
-
Click Column chart, and then select Pie chart.
The display changes to a pie chart.
Test completed task
Click Check my progress to verify your performed task.
Pivot table
-
Return to the Connected Sheet 1 tab, and then click Pivot table.
-
In the Create pivot table dialog, accept the defaults, and then click Create.
-
In the Pivot table editor, do the following:
a. For
Rows, click Add, and then select description.b. For
Columns, click Add, and then select name.c. For
Values, click Add, and then select Sum of Cost. -
Click Apply.
-
To highlight all the rows and columns, click the upper-left empty cell.
-
To resize the cell, click the right outside edge of the top cell of the first column, and then double-click.
The cell width changes to fit the text for each column.
Test completed task
Click Check my progress to verify your performed task.
Task 5. Schedule a refresh of your data
In this task, you periodically refresh your data to keep your spreadsheet current. When you refresh your data, all charts and pivot tables created within the spreadsheet are also refreshed.
To automatically refresh your data, record a macro, and then add a trigger to schedule it.
Record a macro to refresh your data
-
In Google Sheets, click Sheet1.
-
In the menu at the top, click Extensions > Macros > Record Macro.
The macro starts recording steps.
-
Click the Connected Sheet 1 tab, and then click Refresh preview.
-
In the macro dialog, click Save.
-
In the Name field, type Refresh Data, and then click Save.
Schedule your macro
-
In the menu at the top, click Extensions > Apps Script.
Apps Script opens in a new tab.
-
In the Recorded Macros window, in the left pane, click Triggers.
-
In the Welcome dialog, click View Dashboard.
-
In the Triggers window, click Create a new trigger.
The default trigger starts the macro when you open the spreadsheet. You update it to start the macro every 12 hours.
-
In the Add Trigger for Recorded Macros dialog, do the following:
a. Click Select event source, and then select Time-driven.
b. Click Select type of time based trigger, and then select Hour timer.
c. Click Select hour interval, and then select Every 12 hours.
d. Click Save.
-
In the Choose an account dialog, click your lab Username to continue to Recorded Macros.
-
In the Access your Google account dialog, click Allow.
This allows your spreadsheet to view your data in BigQuery and view and manage spreadsheets that this application has been installed in.
-
View your trigger in the trigger list.
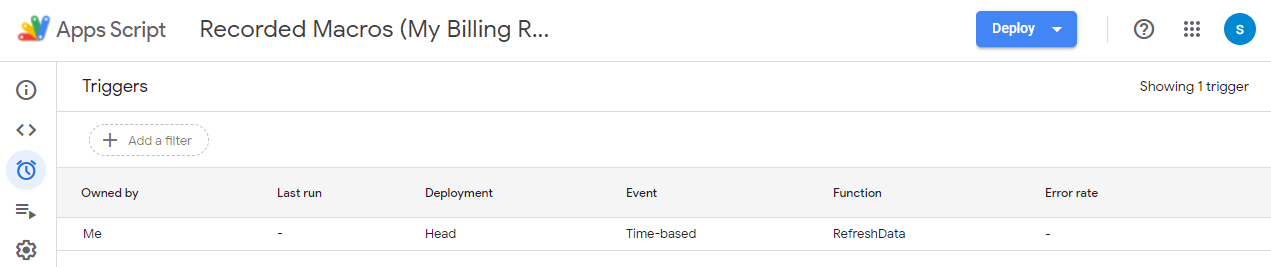
Now your spreadsheet will refresh the data from BigQuery every 12 hours.
Task 6. Change who can see and edit queries and results
In this task, you determine who can see and edit queries and results by setting access to the spreadsheet. You set access by sharing your Sheet.
Share with specific people
-
Return to the Google Sheets tab.
-
In Google Sheets, click Share.
-
In the Share dialog, type an email address of the recipient you want to share the file with.
-
If you don't want to notify recipients that you are sharing the file, clear the Notify people checkbox. If you notify people, each email address you enter will be included in a notification email.
-
Click Share.
Share with a link to the file
In this step you share a link to the file.
-
In Google Sheets, click Share.
-
Click Restricted, and then select Qwiklabs.
-
Click Viewer. See how the options change. Anyone in this group with the link can view, but can't change or share the file with others.
-
Click Commenter. Anyone in this group can make comments and suggestions, but can't change or share the file with others.
-
Click Editor. Anyone in this group can make changes, accept or reject suggestions, and share the file with others. This includes using Sheets data connector to query the source data.
-
Click Copy link.
-
Copy and paste the link into an email.
-
Click Done.
Test completed task
Click Check my progress to verify your performed task.
Congratulations!
You used the Sheets data connector to query BigQuery and pull data into your spreadsheet, then analyzed the data, scheduled the spreadsheet to automatically refresh, and reviewed how you share your spreadsheet.
Finish your quest
This self-paced lab is part of the Understanding Your Google Cloud Costs quest. A quest is a series of related labs that form a learning path. Completing this quest earns you a badge to recognize your achievement. You can make your badge or badges public and link to them in your online resume or social media account. Enroll in this quest and get immediate completion credit. Refer to the Google Cloud Skills Boost catalog for all available quests.
Next steps / Learn more
See Introduction to SQL for BigQuery and Cloud SQL to learn more about BigQuery queries.
Learn more about Google Sheets and the BigQuery connector.
Google Cloud training and certification
...helps you make the most of Google Cloud technologies. Our classes include technical skills and best practices to help you get up to speed quickly and continue your learning journey. We offer fundamental to advanced level training, with on-demand, live, and virtual options to suit your busy schedule. Certifications help you validate and prove your skill and expertise in Google Cloud technologies.
Manual Last Updated January 15, 2024
Lab Last Tested January 15, 2024
Copyright 2024 Google LLC All rights reserved. Google and the Google logo are trademarks of Google LLC. All other company and product names may be trademarks of the respective companies with which they are associated.